- SPX Monitoring purposes; Sold 7/11/18 at 2774.04=gain 2.05%; Long SPX 6/29/18 at 2718.37.
- Monitoring purposes Gold: Long GDX (NYSE:GDX) on 7/6/18 at 22.61
- Long Term Trend SPX monitor purposes; Sold long term SPX 7/16/18 at 2798.43= gain 2.95%; Long 6/29/18 at 2718.37.

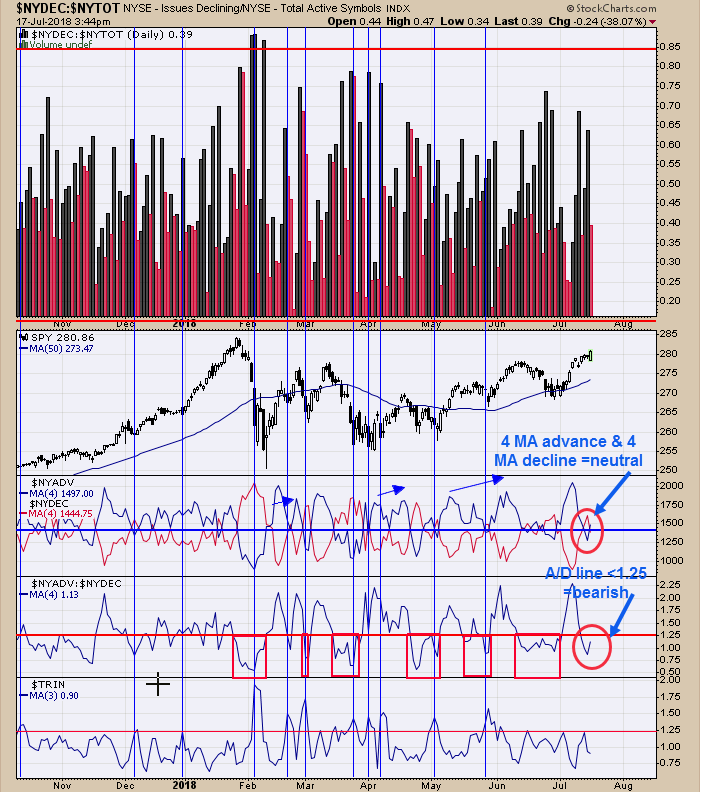
Second window up from the bottom is the Advance/Decline with a 4 period moving average. Reading below 1.25 has been a bearish sign for the SPX. Next window up is the Advancing issues with 4 period moving average and Declining issues with a 4 period moving average. When the blue line is less than red line can lead to declines and vice versa, right now both lines are about equal, which is neutral. Have not recorded panic in the combination of the Tick and TRIN that would suggests a bottom in the market. Today’s candlestick pattern could be a “Bearish last engulfing” which is a bearish pattern. Being patience for now and will wait for the next setup. August and September could see weakness in the markets as seasonality is bearish in that time frame. Sold 7/11/18 at 2774.04=gain 2.05%; Long SPX on 6/29/18 at 2718.67.

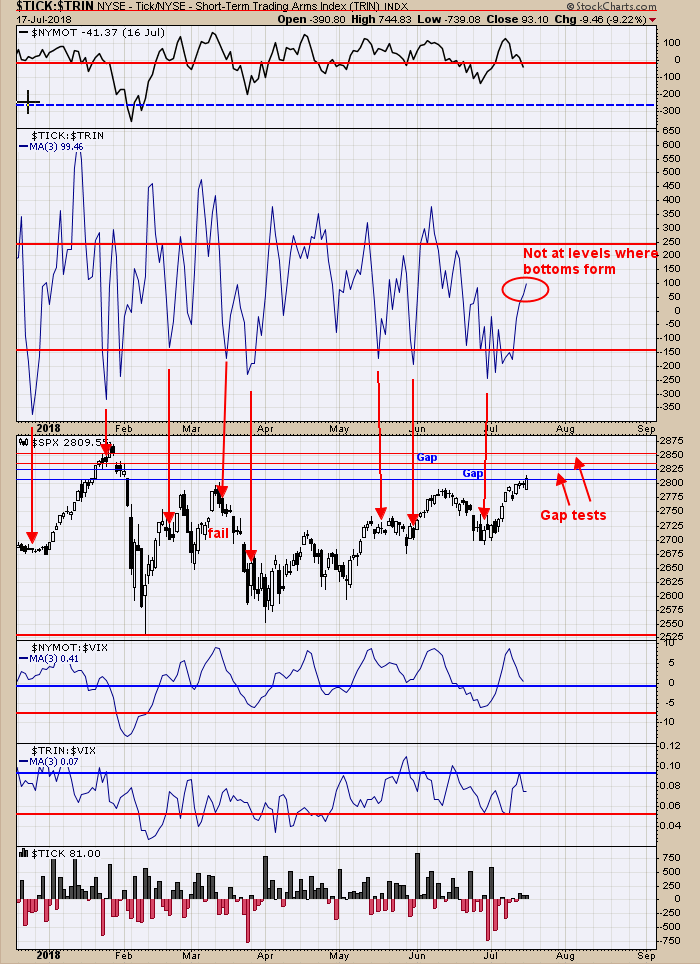
The McClellan Oscillator closed today at -24 and remains below “0”. The July option expiation has a probability of 51.42% of being higher, and seasonality is bullish into mid July. Have said that, we where looking for panic in the tick and trin the last few days to generate energy to drive the market to fill the January and February gaps just above the current SPX price. The middle window is the TICK/TRIN ratio. Bottoms in the market form when the TICK/TRIN ratio reaches below -150 and we don’t have that here. Staying neutral for now. Ask for free 30 day trial.

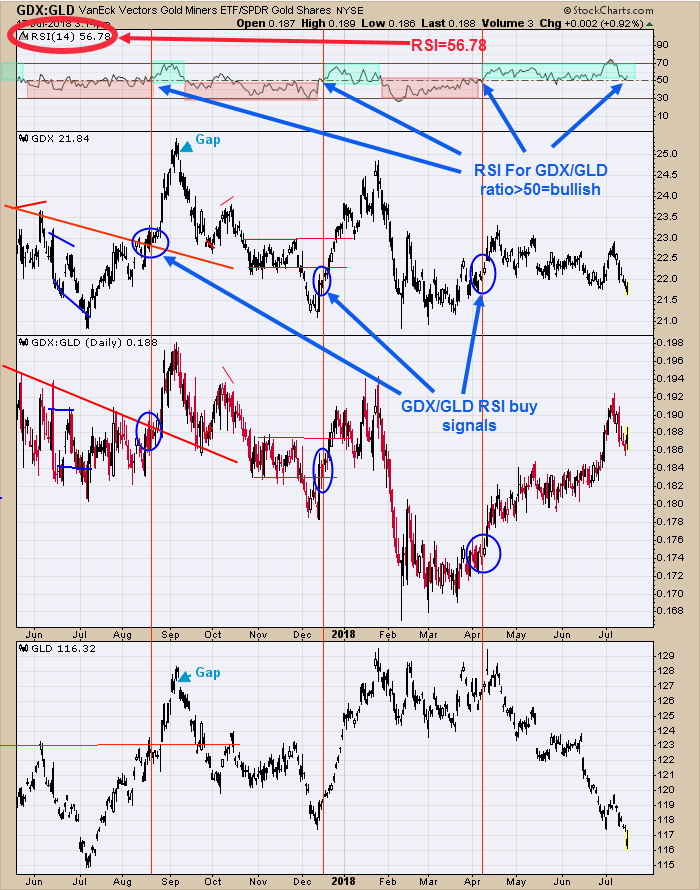
The middle window is the GDX/GLD ratio. Bullish signals for GDX can be triggered with the GDX/GLD ratio. A rising GDX/GLD ratio shows that gold stocks are stronger than gold and a bullish condition for both gold stocks and gold. A bullish signal is triggered for GDX when the RSI for GDX/GLD ratio closes above 50 and a bearish signal when close below 50. A bullish signal was triggered back in early April and since then GDX has just moved sideways. The RSI gained ground form yesterday (closed yesterday 50.91) closed today at 56.78 and remains on a bullish signal. The ratio is acting unusual and may be signaling that something new is about to happen to the current market conditions. If GDX/GLD ratio RSI weakens in the coming days and falls below 50 could jeopardizes our long position in GDX. Long GDX on 7/6/18 at 22.61.
