Micron shares surge amid sharply higher revenue forecasts on AI-led memory demand
The US dollar typically declines at the end of the year – and recovers immediately thereafter
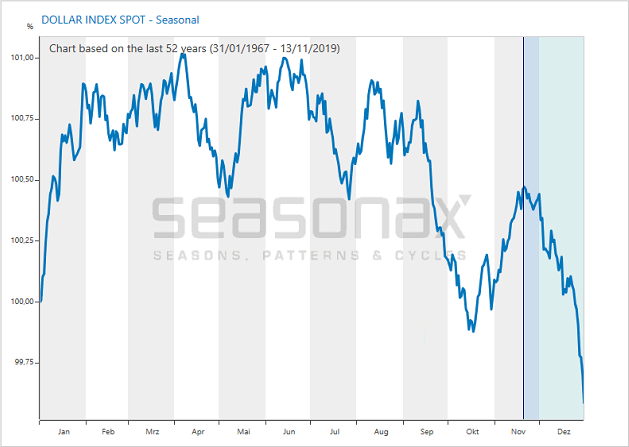
The chart below shows the seasonal pattern of the US dollar index. This is not a standard price chart such as one usually encounters. Instead, the seasonal chart depicts the average price pattern of the dollar index over the course of a calendar year. The horizontal axis shows the time of the year, the vertical axis the average pattern of the past 52 years. Thus one can tell at a glance what the seasonal trends in the US dollar are.

US Dollar Index, seasonal pattern over 52 years
The dollar typically declines at the end of the year
The phase at the end of the year during which the dollar tends to fall is highlighted in blue. This phase begins on 20 November and ends on 31 December. As can also be seen, the dollar typically snaps back thereafter. If you look very carefully at the chart, you will see that the reversal occurs precisely at the turn of the year. This is quite conspicuous, and there has to be a specific reason for this behavior – more on this further below.
Weakness in the US dollar at the end of the year is not a coincidence
The average return of the seasonally weak time period between 20 November and 31 December amounts to 0.90% - quite a sizable percentage, as currencies are far less volatile than e.g. stocks. The following bar chart shows the return of the dollar index in the time period 20 November to 31 December in every year since 1967.
US Dollar Index, percentage return between 20 Nov. and 31 Dec. in every year since 1967
In most cases the dollar declines at the end of the year
The green bars depict rallies, while the red bars depict price declines. The latter dominate both in frequency and extent. This makes clear that the seasonal weakness shown in the first chart was not generated by just a few outliers. But what causes this seasonal weakness in the US dollar?
The reason for dollar weakness at the end of the year
The turning point in the dollar precisely at the turn of the year already hints at the driver of this peculiar seasonal pattern: it has to be associated with the end of the calendar year. And what happens at that time? Balance sheet and/or tax dates!
The decline in the dollar at the end of the year is related to US tax legislation. Many US companies are able to save on taxes by reducing the income they report at the year-end balance sheet date. This can make it worthwhile to shift funds to the accounts of foreign subsidiaries.
The additional supply of dollars generated by this naturally has an impact on foreign exchange rates. Thus the US dollar typically weakens at the end of the year.
After the turn of the year the situation immediately reverses, as companies transfer their funds back to the US. Thus taxes are the reason for the recurring move in the US dollar at the end of the year.
Take advantage of the seasonality of individual stocks
As you can see, seasonality is by no means confined to commodities. Many other instruments such as currencies exhibit seasonal patterns as well – and often for tangible fundamental reasons.
Good luck with your future trades at the end of the year. This time maybe with a look at currencies and taxes.
