In last week’s discussion, we stated the “bear market” was not yet complete. This was despite the “market rally,” which convinced the media the “bull market was back.”

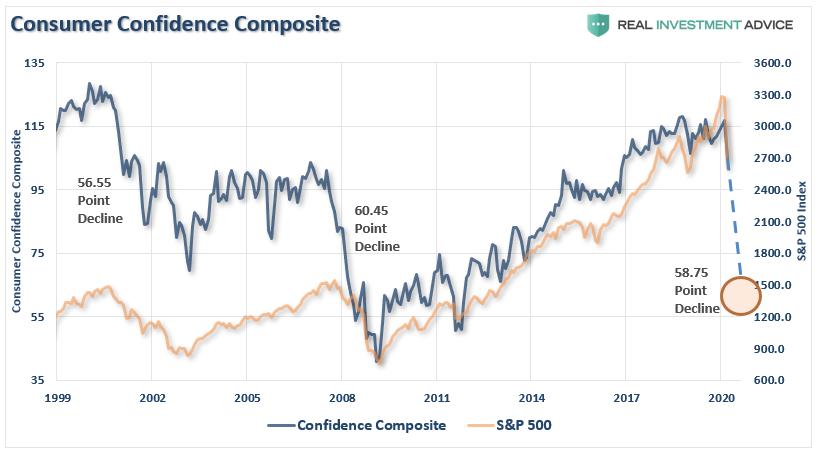
While it was indeed a sharp “reflex rally,” and expected, “bear markets” are not resolved in a single month. Most importantly, as we discussed in our employment report on Thursday, “bear markets” do not end with “consumer confidence” still very elevated.
“Notice that during each of the previous two bear market cycles, confidence dropped by an average of 58 points.”
This past week, we saw early indications of the unemployment that is coming to America as jobless claims surged to 10 million, and unemployment in April will surge to 15-20%.
Confidence, and ultimately consumption, Which comprises 70% of GDP, will plummet as job losses mount. It is incredibly difficult to remain optimistic when you are unemployed.
No Light At The End Of The Tunnel – Yet.
The markets have been clinging on to “hope” that as soon as the virus passes, there will be a sharp “V”-shaped recovery in the economy and markets. While we strongly believe this will not be the case, we do acknowledge there will likely be a short-term market surge as the economy does initially come back “online.” (That surge could be very strong and will once again have the media crowing the “bear market” is over.)
However, for now, we are not there yet. As we noted last week’s Macroview there are two issues currently weighing on the economy and markets, short-term.
“Most importantly, as shown below, the majority of businesses will run out of money long before SBA loans, or financial assistance can be provided. This will lead to higher, and a longer-duration of unemployment.”
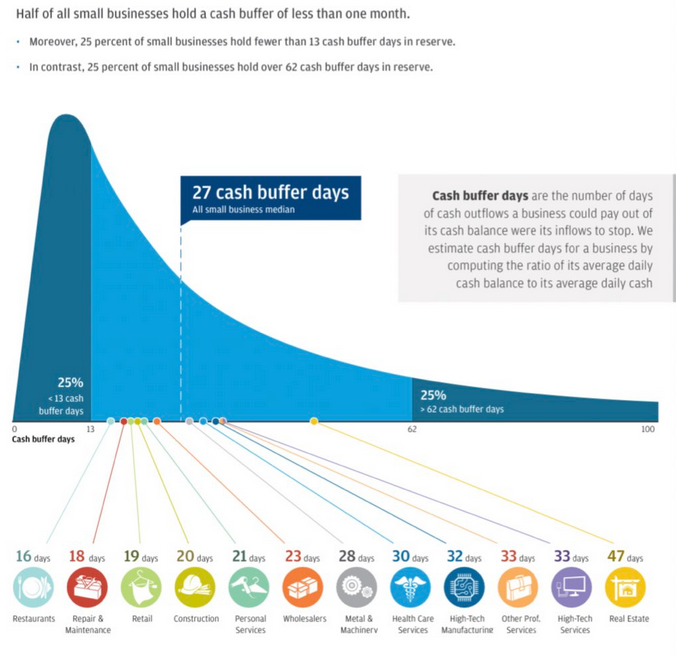
Furthermore, the bill only provides for two and a half times a company’s average monthly payroll expense over the past 12 months. However, the bill fails to take into consideration that not all small businesses are labor and payroll intensive. Those businesses will fail to receive enough support to stay in business for very long. Furthermore, the bill doesn’t provide for inventory, other operating costs, and spoilage.
Small businesses, up to 500-employees, make up 70% of employment in the U.S. While the government is busy bailing out self-dealing publicly traded corporations, there will be a massive wave of defaults in the small- to mid-size business sector.
Secondly, we are not near the end of the virus as of yet. As noted last week:
“While there is much hope that the current ‘economic shutdown’ will end quickly, we are still very early in the infection cycle relative to other countries. Importantly, we are substantially larger than most, and on a GDP basis, the damage will be worse.”
This was confirmed again this week by the New York Times’ columnist David Leonhardt:
“Five ways we know that the American response to the coronavirus isn’t yet working.
- There is still no sign of the curve flattening.
- The caseload is growing more rapidly here than in Europe.
- The shortage of medical supplies continues.
- There is still a testing shortage.
- Nationwide, the policy response remains inconsistent.

What the cycle tells us is that jobless claims, unemployment, and economic growth are going to worsen materially over the next couple of quarters.
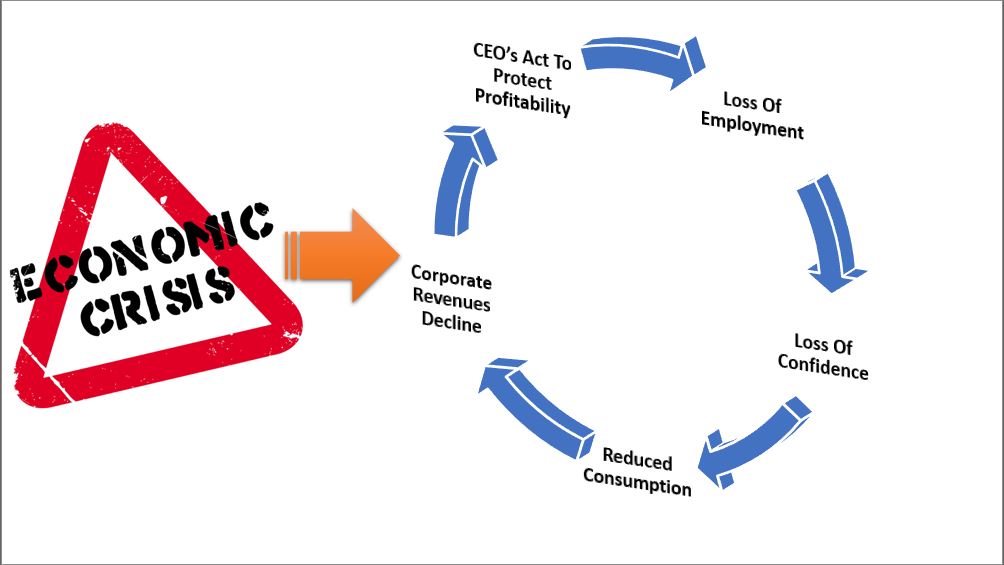
The problem with the current economic backdrop, and mounting job losses, is the vast majority of American’s were woefully unprepared for any disruption to their income going into recession. As job losses mount, a virtual spiral in the economy begins as reductions in spending put further pressures on corporate profitability. Lower profits lead to higher unemployment and lower asset prices until the cycle is complete.
Two important points:
- The economy will eventually recover, and life will return to normal.
- The damage will take longer to heal, and future growth will run at a lower long-term rate due to the escalation of debts and deficits.
For investors, this means a greater range of stock market volatility and near-zero rates of return over the next decade.
The Bear Still Rules
Over the last two weeks, we published several pieces of analysis discussing why the “bear market rally” should be sold into. On Friday, our colleague, Jeffery Marcus of TP Analytics, penned the following:
Meanwhile, the charts below of the S&P500 benchmark tell TPA the following:
- When the 11-year bull market trend ended, other shorter trends were also violated. In late February, the S&P 500 fell below its 14-month uptrend line, and in early March the 13-month uptrend line was violated. Those breaks set in place the steep declines seen in the 2nd and 3rd weeks of March.
- While it may seem like an epic battle is going on around S&P 500 2500, the real problem is the downtrend forming from the 2/19 high.
- TPA still continues to see real long term support in the 3% range between 2110 and 2180. A less likely move below that support, would leave long term support levels of the lows of 2014 and 2015.
S&P 500 – Long Term
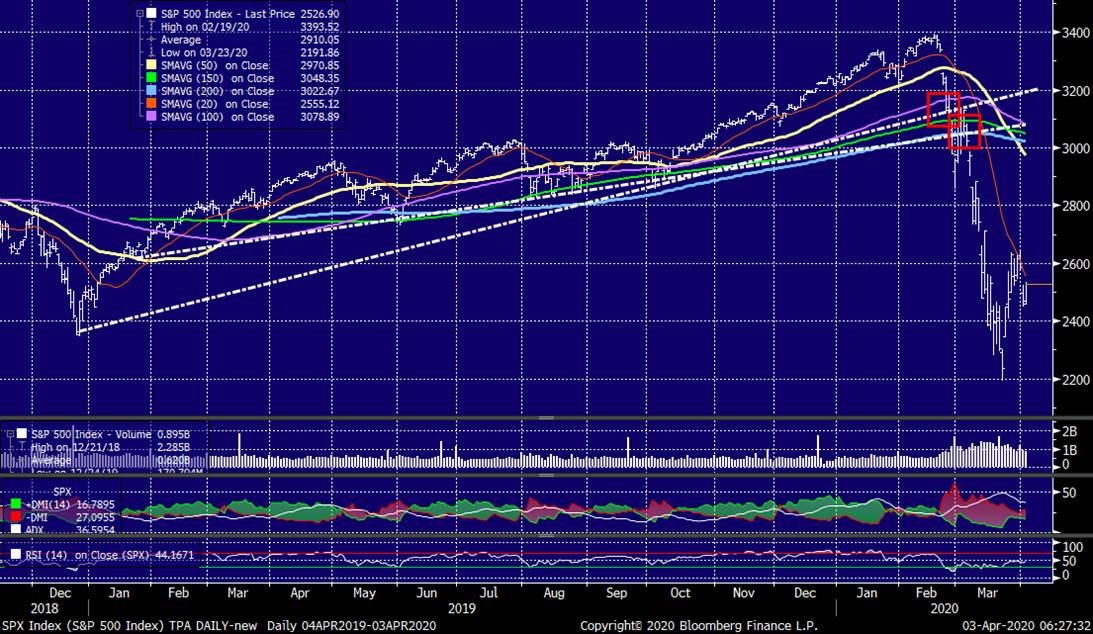
His analysis agrees with our own, which we discussed with you on Tuesday:
“While the technical picture of the market also suggests the recent “bear market” rally will likely fade sooner than later. As we stated last week:
‘Such an advance will ‘lure’ investors back into the market, thinking the ‘bear market’ is over.’
Importantly, despite the sizable rally, participation has remained extraordinarily weak. If the market was seeing strong buying, as suggested by the media, then we should see sizable upticks in the percent measures of advancing issues, issues at new highs, and a rising number of stocks above their 200-dma.”
Chart updated through Friday.
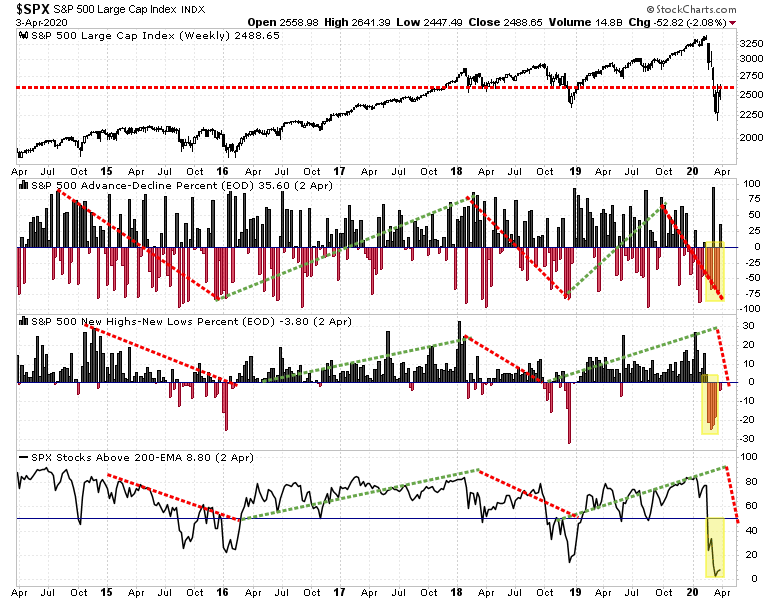
On a daily basis, these measures all have room to improve in the short-term. However, the market has now confirmed longer-term technical signals suggesting the “bear market” has only just started.
Major Technical Failures
Price is nothing more than a reflection of the “psychology” of market participants. The mistake the media made by calling an “end” to the “bear market” is they were using an outdated proxy of a “20% advance or decline” to distinguish between the two.
However, due to a decade-long bull market, which had stretched prices to historical extremes above long-term trends, that 20% measure is no longer valid.
Let’s clarify.
- A bull market is when the price of the market is trending higher over a long-term period.
- A bear market is when the long-term upward trending advance is broken and prices begin to trend lower.
The chart below provides a visual of the distinction. When you look at price “trends,” the difference becomes both apparent and more useful.
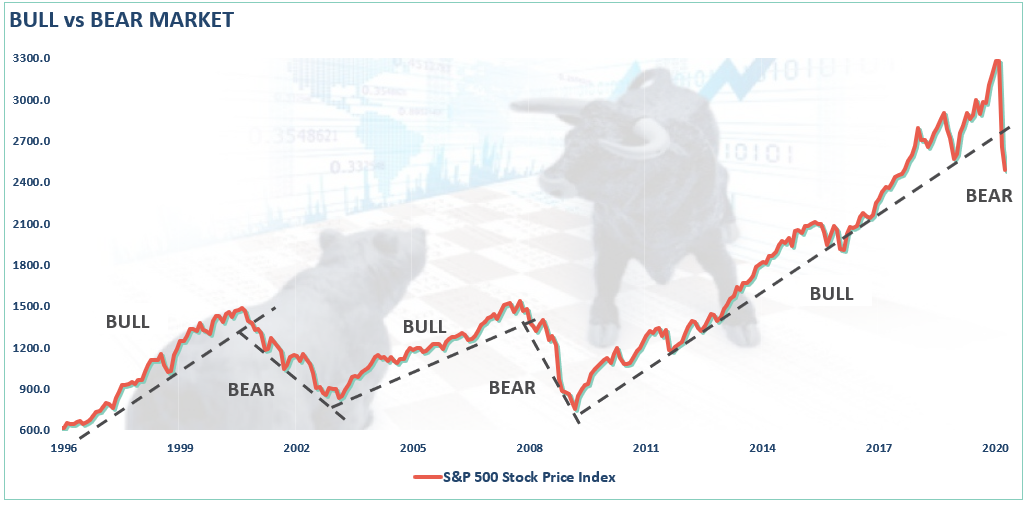
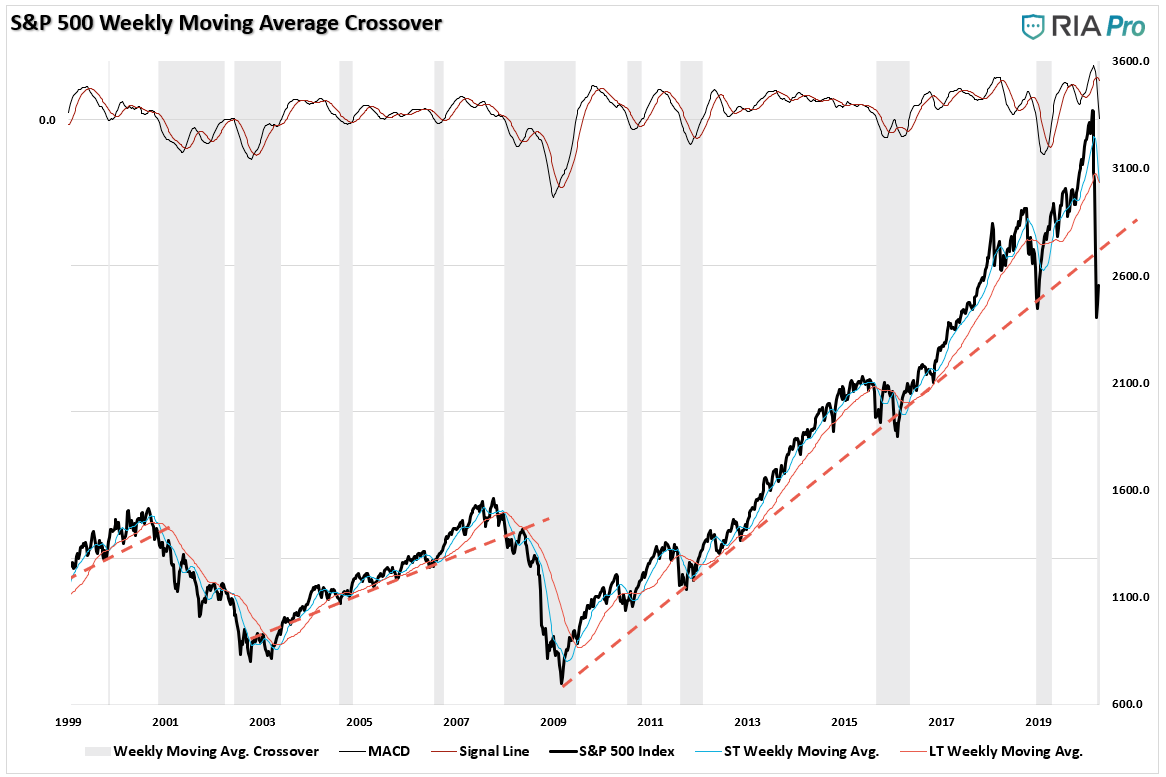
This distinction is important. With the month, and quarter-end, behind us, we can now analyze our longer-term weekly and monthly price trends to make determinations about the market.
The market has now violated the 200-week (4-year) moving average. Given this is such a long-term trend line, such a violation should be taken seriously. Also, that violation will be very difficult to reverse in the short-term, and suggests lower prices to come for the market.
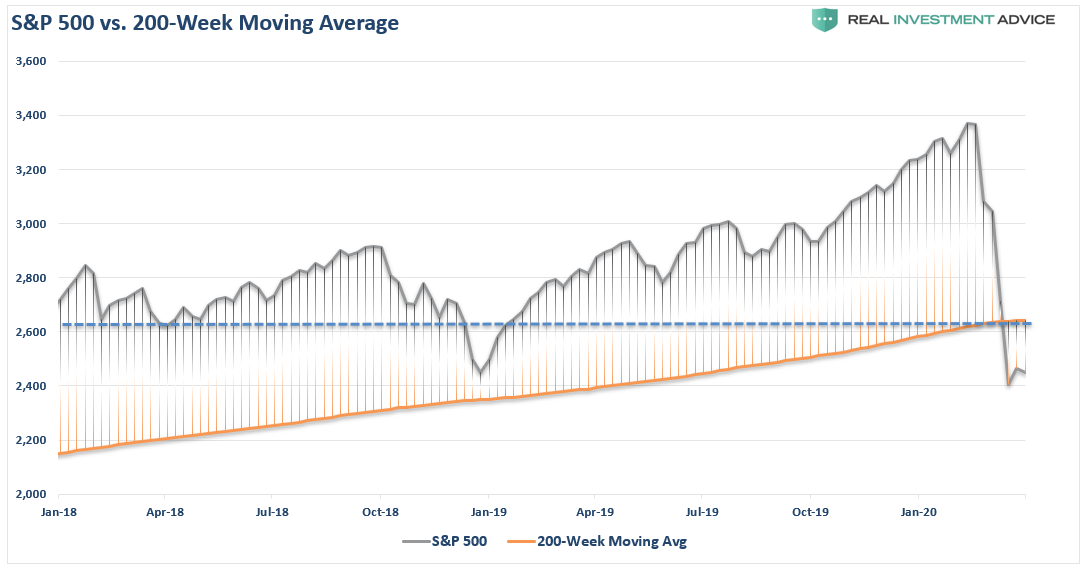
Using the definition of “bull and bear” markets above, the market has also violated the long-term “bull trend” on a “confirmed” basis.
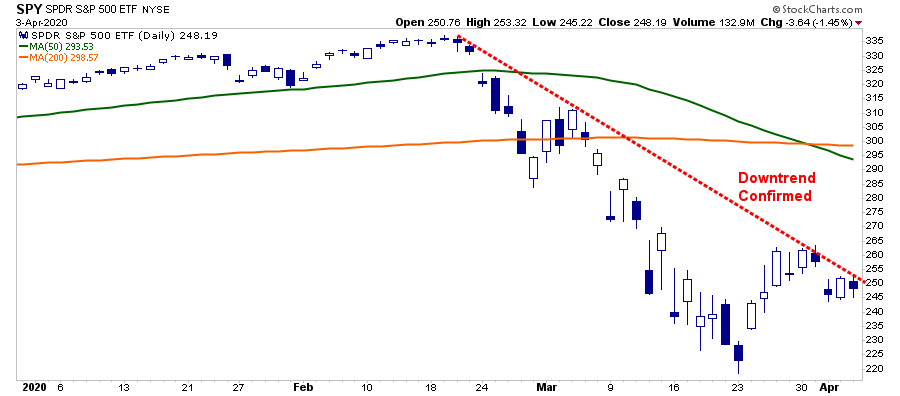
A confirmed basis is when the market violates a long-term trend, rallies, and then fails. As Jeffery Marcus, noted above, that market is now establishing a confirmed downtrend with the recent rally failing at downtrend resistance. (Also, the 50-200 dma negative cross will apply more downward pressure on any forthcoming rally.)
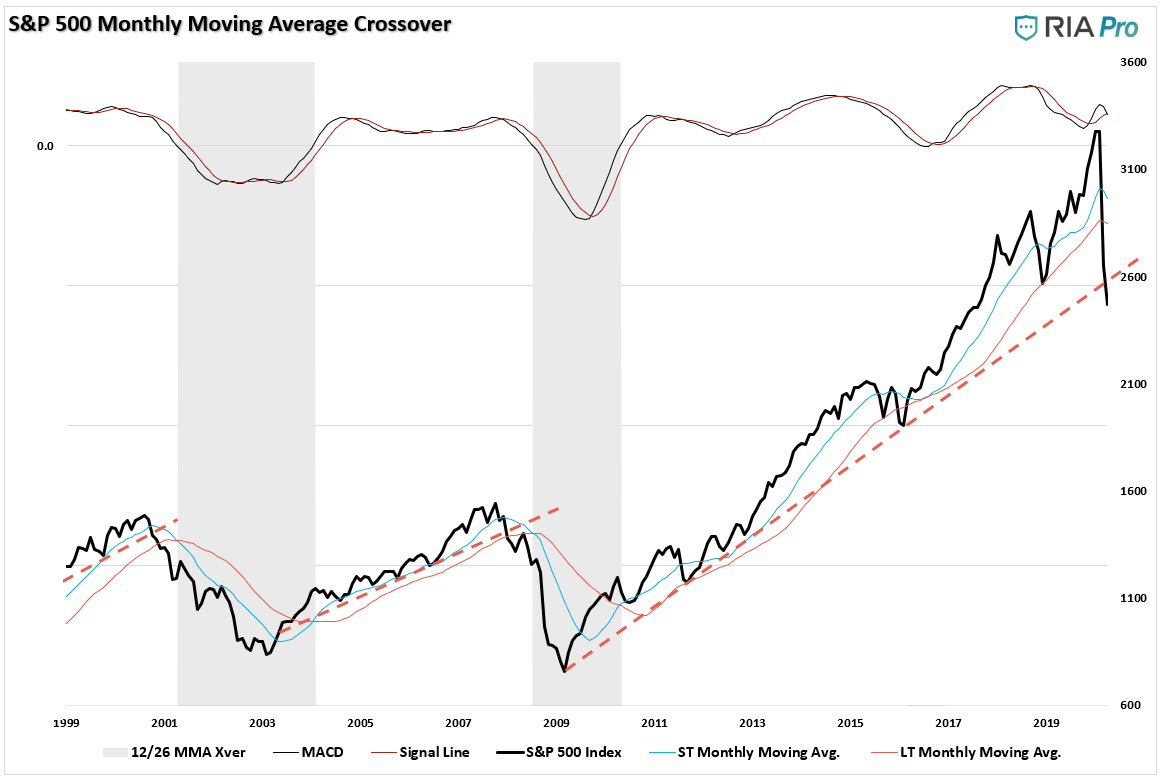
Most importantly, for the first time since the “Great Financial Crisis” lows, the market now has a confirmed close below the bull-trend line. If the market is able to rally in April, and close above the long-term trend line, then the “bull market” will technically still be intact. However, if the month of April closes below that trend, a confirmed “bear market” will be underway and suggests markets will see lower levels before it is over.
There are reasons to be optimistic about the markets in the very short-term. We will get through this crisis. People will return to work. The economy will start moving forward again.
However, it won’t immediately go right back to where we were previously. We are continuing to extend the amount of time the economy will be “shut down,” which exacerbates the decline in the employment, and personal consumption data. The feedback loop from that data into corporate profits, and earnings, is going to make valuations more problematic even with low-interest rates currently.
This is NOT the time to try and “speculate” on the bottom of the market. You might get lucky, but there is very high risk you could wind up losing even more capital.
For long-term investors, remain patient and let the market dictate when the bottom has been formed.
This was a point we discussed in “Rothschild’s 80/20 Rule:”
You can have the top 20% and the bottom 20%, I will take the 80% in the middle.” – Rothschild
This is the basis of the 80/20 investment philosophy and the driver behind our risk management process at RIA.
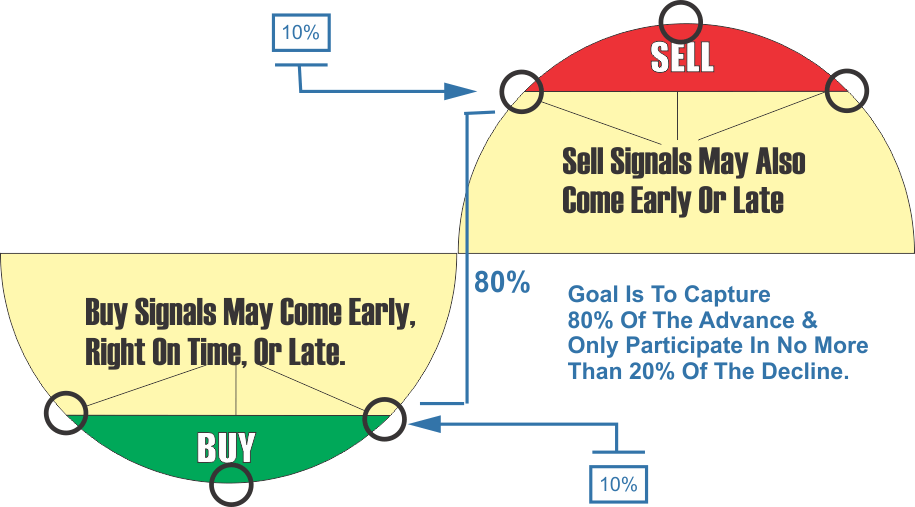
Yes, you may sell to early and miss 10% before the peak, or you sell a little late and lose 10% from the peak. Likewise, you may start buying into the market 10% before, or after, it bottoms. The goal is to capture the bulk of the advance and miss the majority of the decline.
Investing isn’t a competition of who gets to say “I bought the bottom.” Investing is about putting capital to work when reward outweighs the risk.
That is not today.
Bear markets have a way of “suckering” investors back into the market to inflict the most pain possible.
This is why “bear markets” never end with optimism but in despair.
Market & Sector Analysis
Data Analysis Of The Market & Sectors For Traders
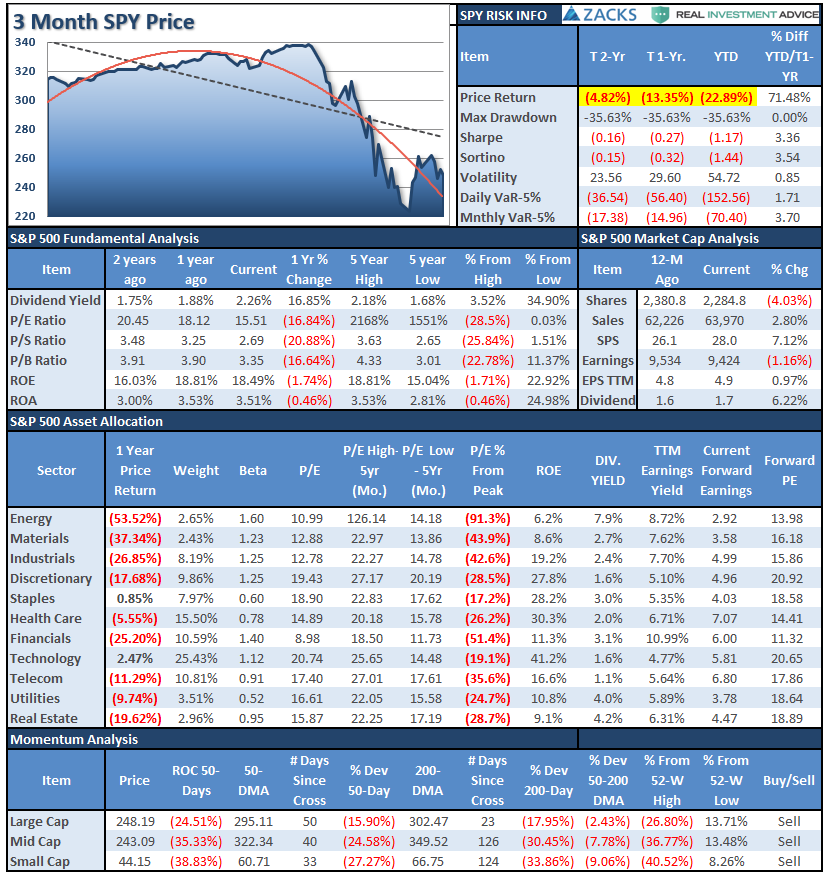
S&P 500 Tear Sheet
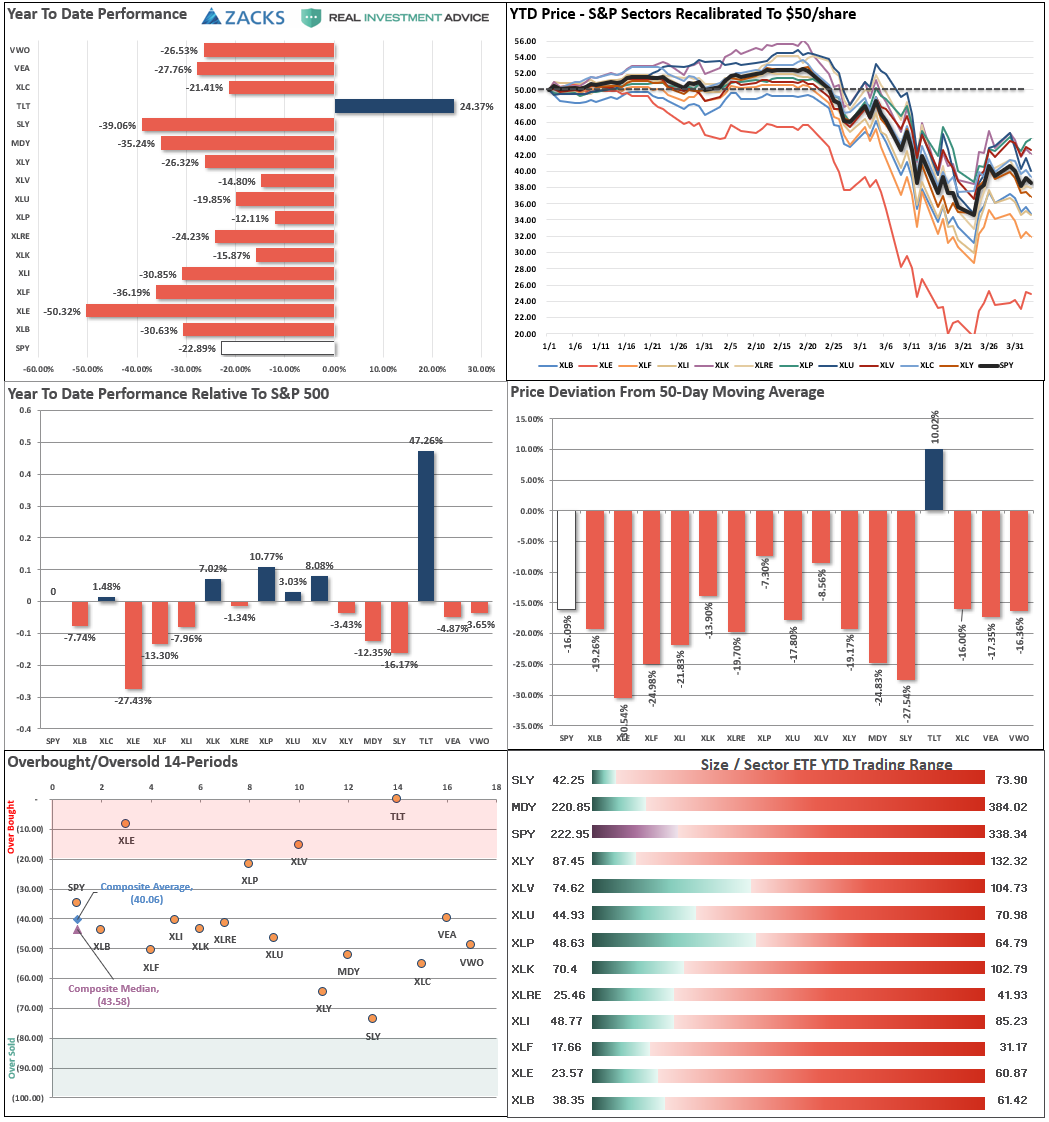
Performance Analysis
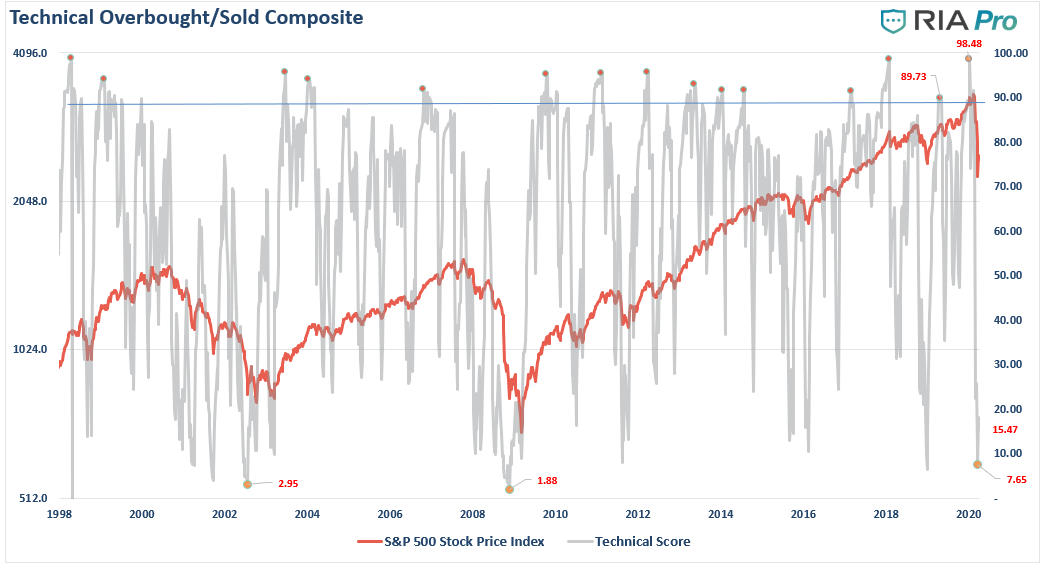
Technical Composite
Note: The technical gauge bounced from the lowest level since both the “Dot.com” and “Financial Crisis.” However, note the gauge bottoms BEFORE the market bottoms. In 2002, lows were retested. In 2008, there was an additional 22% decline in early 2009.
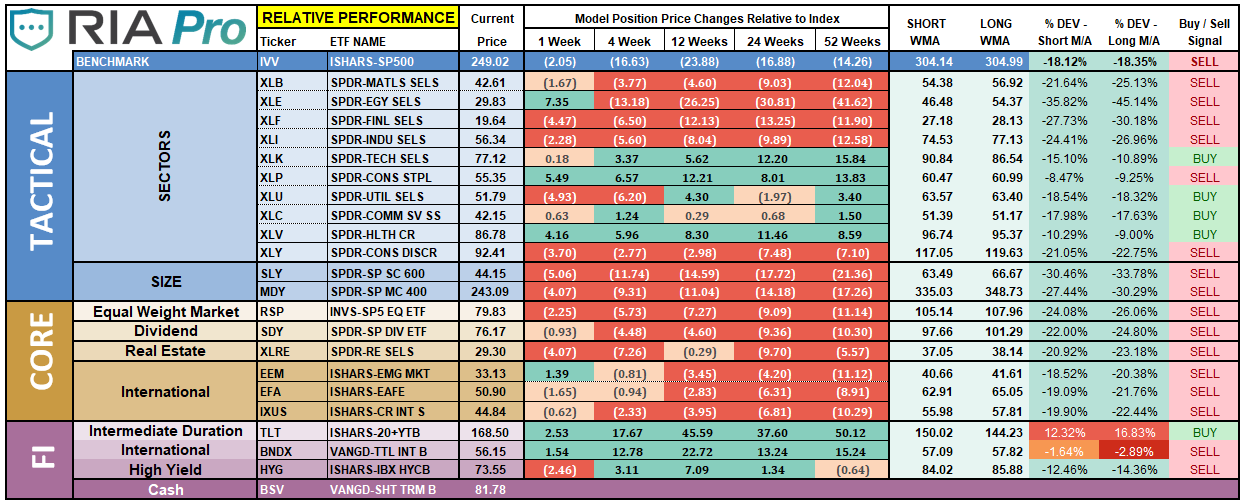
ETF Model Relative Performance Analysis
Sector & Market Analysis:
Be sure and catch our updates on Major Markets (Monday) and Major Sectors (Tuesday) with updated buy/stop/sell levels
Sector-by-Sector
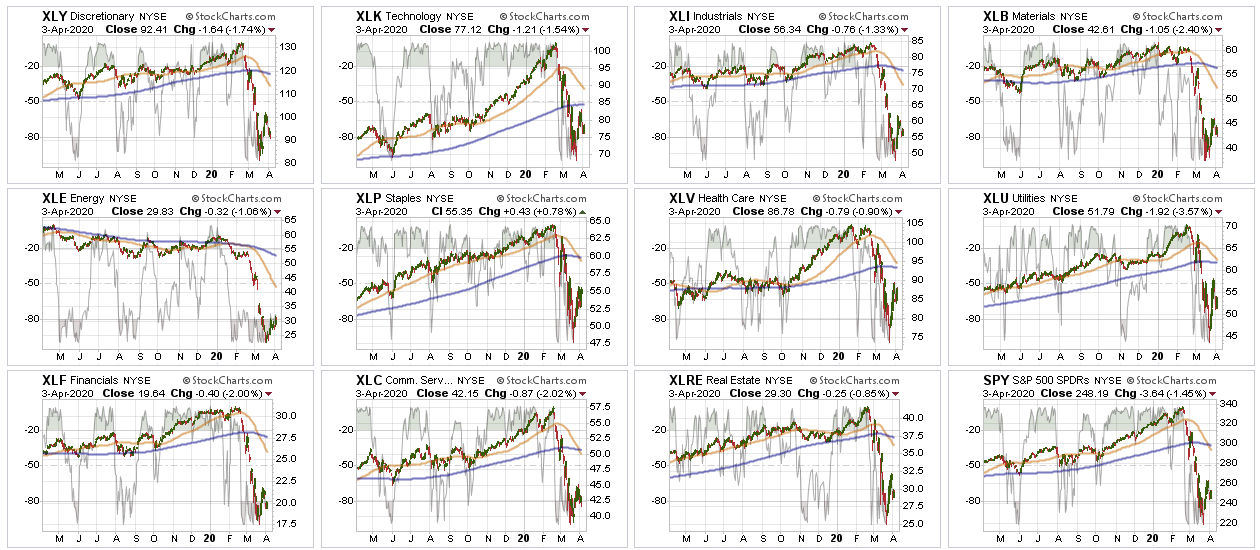
The bounce from last week, as expected, failed.
There are no changes to our sector recommendations from last week.
Improving – Discretionary (NYSE:XLY), and Real Estate (NYSE:XLRE)
We previously reduced our weightings to Real Estate and liquidated Discretionary entirely over concerns of the virus and impact on the economy. No change this week. We are getting more interested in REITs again, but are going to select individual holdings versus the ETF due to leverage concerns in the REITs.
Discretionary is going to remain under pressure due to people being unable to go out and shop. This sector will eventually get a bid, so we are watching it, but we need to see an eventual end to the isolation of consumers.
Current Positions: No Positions
Outperforming – Technology (NYSE:XLK), Communications (NYSE:XLC), Staples (NYSE:XLP), Healthcare (NYSE:XLV), and Utilities (NYSE:XLU).
Two weeks ago, we shifted exposures in portfolios and added to our Technology and Communications sectors, bringing them up to weight. We remain long sectors that are currently outperforming the S&P 500 on a relative basis and have less “virus” exposure.
Current Positions: XLK, XLC, 1/2 weight XLP, XLV
Weakening – None
No sectors in this quadrant.
Current Position: None
Lagging – Industrials (NYSE:XLI), Financials (NYSE:XLF), Materials (NYSE:XLB), and Energy (NYSE:XLE)
No change from last week, with the exception that performance continued to be worse than the overall market.
These sectors are THE most sensitive to Fed actions (XLF) and the shutdown of the economy. We eliminated all holdings in late February and early March.
Current Position: None
Market By Market
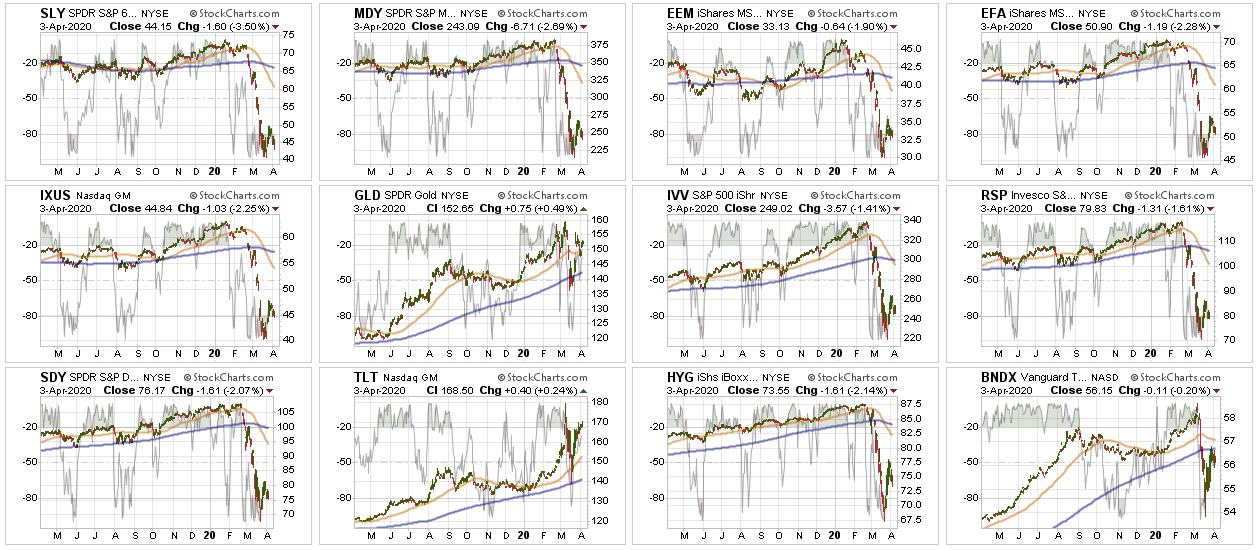
Small-Cap (NYSE:SLY) and Mid Cap (NYSE:MDY) – Five weeks ago, we sold all small-cap and mid-cap exposure over concerns of the impact of the coronavirus. We remain out of these sectors for now.
Current Position: None
Emerging, International (NYSE:EEM) & Total International Markets (NYSE:EFA)
Same as small-cap and mid-cap. Given the spread of the virus and the impact on the global supply chain.
Current Position: None
S&P 500 Index (Core Holding) – Given the overall uncertainty of the broad market, we previously closed out our long-term core holdings. We will re-add a core once we see a bottom in the market has formed.
Current Position: None
Gold (NYSE:GLD) – We added a small position in GDX (NYSE:GDX) recently, and increased our position in IAU last week. With the Fed going crazy with liquidity, this will be good for gold long-term, so we continue to add to our holdings on corrections.
Current Position: 1/4th weightGDX, 1/2 weight IAU
Bonds (NASDAQ:TLT) –
Bonds have rallied as the Fed has become THE “buyer” of bonds on both a “first” and “last” resort. Simply, “bonds will not be allowed to default,” as the Fed will guarantee payments to creditors. We have now reduced our total bond exposure to 20% of the portfolio from 40% since we are only carrying 10% equity currently. (Rebalanced our hedge.)
Current Positions: SHY, IEF, BIL
Sector / Market Recommendations
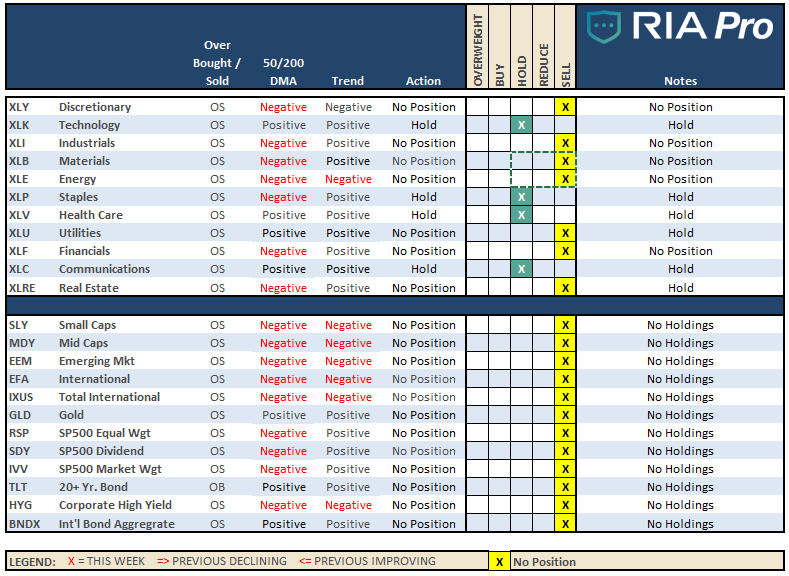
The table below shows thoughts on specific actions related to the current market environment.
(These are not recommendations or solicitations to take any action. This is for informational purposes only related to market extremes and contrarian positioning within portfolios. Use at your own risk and peril.)
