Stock market today: S&P 500 closes higher in thin holiday trading
Financial stocks should benefit from phenomenal employment trends as well as rising rates. Yet the Financial Select Sector SPDR (NYSE:XLF) is down roughly 12% from a 2018 high and down nearly 5% year-to-date.
Cyclical stocks should excel in a strong economic environment. Nevertheless, the iShares Transportation Average ETF (NYSE:IYT) is down approximately 11% from its 2018 peak and down 3.5% this year.
Facebook (NASDAQ:FB), Amazon (NASDAQ:AMZN), Netflix (NASDAQ:NFLX) and Google (NASDAQ:GOOGL)? Market-driving FANG stocks? Tech leadership is off anywhere from 16%-30% from record-breaking tops.
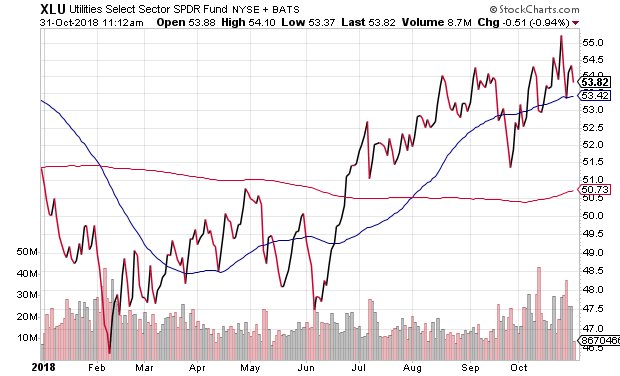
At present, there are only three economic sectors that boast technical uptrends. Consumer staples, utilities and healthcare. In essence, investors have shifted to a decidedly defensive stance, in spite of the reality that few economists see recession risks.
XLU
The fact that the investment community has shifted to a more defensive posture may not derail the bull, however. At least not in the near-term. Mutual funds close the books for the fiscal year today, Wednesday, October 31. Fund managers regularly sell their losers for tax purposes in October, then become buyers in November in an attempt to improve performance by year-end.
There’s more.
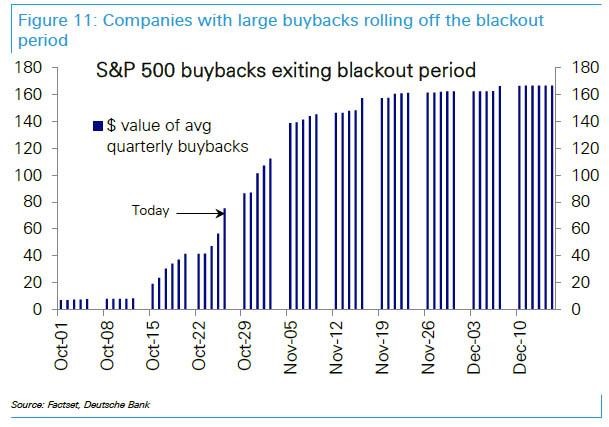
Not only will election angst terminate in the early part of November, but an increasing number of S&P 500 companies will be permitted to resume buying back their stock shares. In other words, when their “blackout periods” have run their course, buybacks may begin bolstering prices once again.
Granted, there are plenty of reasons to anticipate recovery for U.S. stocks in the near-term. On the flip side, the ongoing tightening campaign by the Federal Reserve remains the most critical element in play for asset prices worldwide.
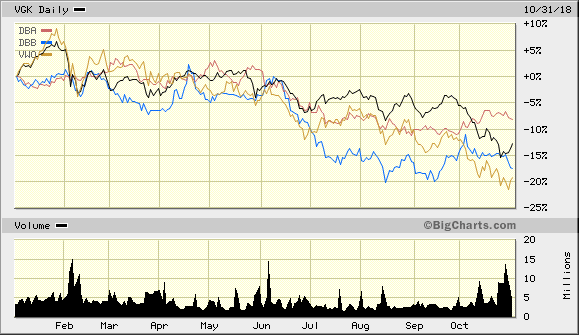
With borrowing costs rising for dollar-denominated borrowers, European stocks in Vanguard FTSE Europe (NYSE:VGK) and emerging stocks in Vanguard FTSE Emerging Markets (NYSE:VWO) continue to lose significant ground. Meanwhile, the threat of an economic slowdown abroad, whether a function of tariffs or diminishing central-bank support, has punished agricultural and metal commodities alike.
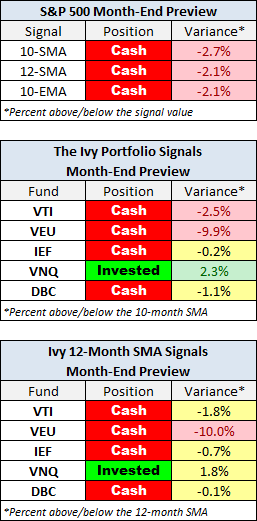
Another way to illustrate how unfriendly the investing environment may be is to examine asset classes across 10- and 12-month time horizons. More specifically, how are asset classes performing in relation to their longer-term 10- and 12-month trendlines?
The following table outlines whether or not the price of the S&P 500 (as well as a variety of key asset types) is above or below a longer-term trend. End-of-month trend followers raise cash when the monthly close is below trend.
Clearly, most asset classes are struggling like leopard sharks on the lines of ocean pier anglers. (Note: The signals in the table are NOT official month-end signals. They show the status as of Tuesday, October 30.)
Certainly, a trader might look to “go long” in November. He/she has seasonality, buybacks and domestic economic strength on his/her side. Still, the fact that wages/salaries experienced their largest quarter-over-quarter increase in a decade (3.1%) implies that the Fed will continue raising overnight lending rates regardless of how loud investors whine and complain.
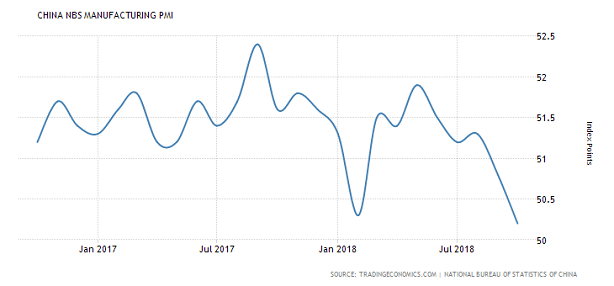
Additionally, U.S. investors might wish to consider the impact of foreign economic troubles on domestic prospects going forward. For example, if 25% tariffs on Chinese goods actually take effect on January 1, pushing a teetering Chinese economy into recession, will U.S. companies remain unscathed? Not only did China’s PMI come in at a mere 50.2 (less than 50 expresses contraction), but export orders contracted for a fifth consecutive month.
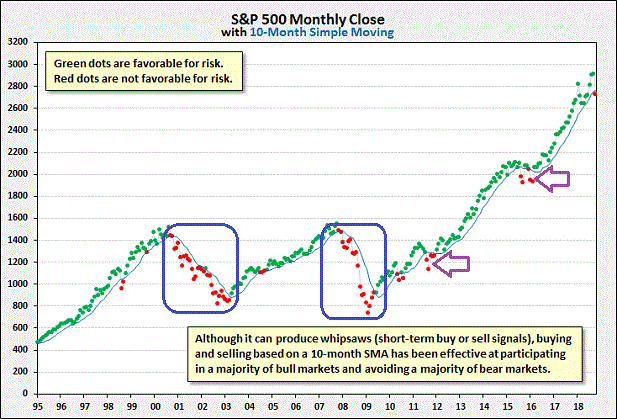
As regular readers of my commentary already recognize, I will be reducing client exposure to U.S. equities as a function of a time-tested discipline. Specifically, with the monthly close on the S&P 500 (2711.74) beneath its long-term 10-month moving average (2759 on 10/31), I will be lowering the stock allocation on Thursday, 11/1/2018; most portfolios with 50%-60% U.S. large-cap exposure will be downshifted to an approximate range of 30%-35%.
We sidestepped volatility during the oil collapse and global economic downturn (2015-2016). We moved to the sidelines during the European debt crisis (2011). And yes, a case could be made that we could have done just as well to hold-n-hope every position through the duration of those predicaments.
On the other hand, my clients were rather pleased to sleep better at night, knowing that we were minimizing the possibility of extreme losses first. After all, it is the very same sensible approach to risk management that made it possible to lessen the adverse impact of the tech wreck (2000) and the global financial catastrophe (2008).
