
Keurig Dr Pepper Inc. (NYSE:KDP) reported third-quarter 2019 results, wherein sales and earnings beat the Zacks Consensus Estimate and improved year over year. Results benefited from strong underlying sales growth, margin expansion and reduced debt. Backed by strong results, shares of the company gained 5.9% on Nov 7.
Adjusted earnings of 32 cents per share improved 6.7% year over year and surpassed the Zacks Consensus Estimate of 31 cents. This improvement was driven by strong underlying growth across all segments, adjusted operating margin expansion and reduced indebtedness.
Keurig Dr Pepper, Inc Price, Consensus and EPS Surprise
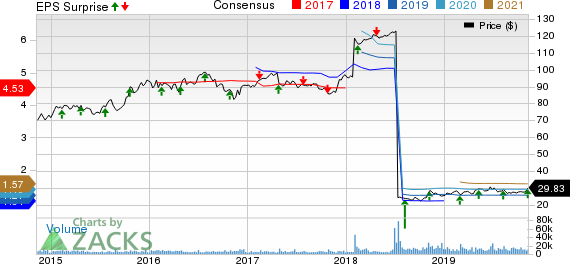
Keurig Dr Pepper, Inc price-consensus-eps-surprise-chart | Keurig Dr Pepper, Inc Quote
Net sales in the quarter under review were $2,870 million, which beat the Zacks Consensus Estimate of $2,860 million and rose 0.5% from adjusted pro forma net sales of $2,856 million (including merger-related adjustments) in the year-ago quarter. The increase was driven by strong underlying net sales growth of 3.1%, partly negated by 2.7% adverse effects of the changes made to its Allied Brands portfolio and a 0.2% impact of negative currency translations.
The rise in underlying net sales was driven by balanced contribution from volume/mix and pricing. Notably, volume/mix improved 1.5%, with 1.6% increase in net price realization. Moreover, the top line included a 0.3% benefit from an additional shipping day.
In the third quarter, the company benefited from strong in-market performance. Keurig Dr Pepper witnessed dollar consumption growth, with market share gains across its several major categories —including CSD's3, premium unflavored still water, shelf stable fruit drinks and shelf stable apple juice. The uptick was backed by strength in Dr Pepper and Canada Dry CSDs, CORE Hydration, Snapple juice drinks and Motts apple juice.
Further, in coffee, retail consumption for single-serve pods manufactured by KDP rose nearly 2% in channels tracked by IRI. The coffee business also witnessed robust growth in untracked channels, particularly in e-commerce and Canada. Further, dollar market share in tracked channels in the United States was 81.4% for the 52-week period ending September.
Adjusted operating income grew 0.8% year over year to $754 million, driven by strong underlying net sales growth as well as solid productivity and merger synergies, which leveraged costs of goods sold and SG&A expenses. This was partly offset by inflation, packaging and logistics in particular along with unfavorable comparison due to $6-million gain recorded in the year-ago quarter related to the Big Red acquisition. Meanwhile, adjusted operating margin expanded 190 basis points (bps) to 26.3%.
Segmental Details
Sales at the Beverage Concentrates segment rose 8.8% year over year to $360 million from adjusted pro forma net sales of $331 million in the year-ago quarter. Net revenues primarily benefited from 6.5% higher net price realizations and a 2.3% increase in volume/mix.
Sales at the Packaged Beverages segment totaled $1.31 billion, down 2.2% from adjusted pro forma net sales of $1.34 billion in the year-ago quarter. The downturn can be primarily attributed to a 5.8% impact of changes in the Allied Brands portfolio and 0.1% adverse currency effects. However, this was mitigated with underlying sales growth of 3.1%, driven by a 2.7% increase in prices and 0.4% rise in volume/mix. Further, the segment witnessed 0.6% gain from an additional shipping day in the third quarter.
Sales from the Latin America Beverages segment improved 1.5% to $138 million from adjusted pro forma net sales of $136 million in the prior-year quarter. Gains from 5.2% rise in price realization were partly offset by a 1.5% fall in volume/mix and a 2.2% impact of negative currency translations.
The Coffee Systems segment’s sales increased 1.1% to $1,065 million from $1,053 million recorded in the year-ago quarter. The increase was backed by improved volume/mix, offset by lower pricing and unfavorable currency. Volume/mix grew 3.1%, benefiting from a 6.1% increase in pod volume and 8% rise in brewer volume, offset by adverse pod sales mix.
Financials
Keurig Dr Pepper ended the third quarter with cash and cash equivalents of $74 million as of Sep 30, 2019, compared with $83 million as of Dec 31, 2018. Long-term obligations totaled $13,147 million and total stockholders’ equity was $22,914 million. Net cash provided by operating activities totaled $1,803 million as of Sep 30, 2019.
Outlook
Keurig Dr Pepper reiterated the guidance for 2019. The company continues to anticipate adjusted earnings per share growth of 15-17%, which is in line with the long-term target set at the time of the merger for the 2018-2021 period. This brings its adjusted earnings guidance to $1.20-$1.22 per share for 2019.
The company now expects net sales growth of about 3%, which is at the high-end of its long-term sales growth target of 2-3%. The robust sales view is supported by expectations of continued strong performance of core brands and lesser inclination of Allied Brands. Further, it anticipates capturing merger synergies of $200 million in the current year, consistent with the long-term target of capturing $200-million synergies every year between 2019 and 2021.
Adjusted other net expenses are projected to be $30 million in 2019. Adjusted interest expenses are likely to be $550-$565 million, including $40-million gains from the unwinding interest rate swap contracts in the first half of 2019. Adjusted effective tax is expected to be 25-25.5%, with outstanding shares estimated at 1,420 million.
Additionally, the company expects significant cash flow generation and rapid deleveraging. It expects to generate free cash flow of $2.3-$2.5 billion in 2019, with leverage ratio of 4.4x to 4.5x at the end of 2019. Further, the company reiterated its leverage ratio target of less than 3.0x in two to three years, since the closing of the merger in July 2018.
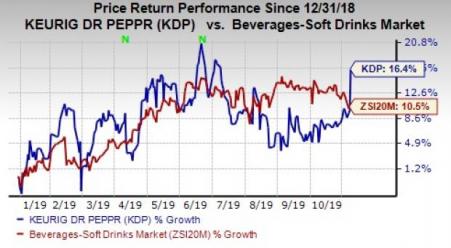
Price Performance
Year to date, shares of the Zacks Rank #3 (Hold) company has gained 16.4% compared with the industry’s growth of 10.5%.
3 Better-Ranked Beverage Stocks
The Boston Beer Company, Inc (NYSE:SAM) has an expected long-term earnings growth rate of 10%. It currently sports a Zacks Rank #1 (Strong Buy). You can see the complete list of today’s Zacks #1 Rank stocks here.
Carlsberg (CSE:CARLa) AS (OTC:CABGY) , with a long-term earnings growth rate of 5%, currently carries a Zacks Rank #2 (Buy).
Coca-Cola (NYSE:KO) HBC (OTC:CCHGY) has an expected long-term earnings growth rate of 8% and a Zacks Rank #2.
Today's Best Stocks from Zacks
Would you like to see the updated picks from our best market-beating strategies? From 2017 through 2018, while the S&P 500 gained +15.8%, five of our screens returned +38.0%, +61.3%, +61.6%, +68.1%, and +98.3%.
This outperformance has not just been a recent phenomenon. From 2000 – 2018, while the S&P averaged +4.8% per year, our top strategies averaged up to +56.2% per year.
See their latest picks free >>
The Boston Beer Company, Inc. (SAM): Free Stock Analysis Report
Carlsberg AS (CABGY): Free Stock Analysis Report
COCA-COLA HBC (CCHGY): Free Stock Analysis Report
Keurig Dr Pepper, Inc (KDP): Free Stock Analysis Report
Original post