Get 40% Off
🤯 Perficient is up a mind-blowing 53%. Our ProPicks AI saw the buying opportunity in March.Read full update

It Ended Up Being A Turnaround Tuesday After All

Published 07/22/2020, 12:14 AM
Updated 09/20/2023, 06:34 AM

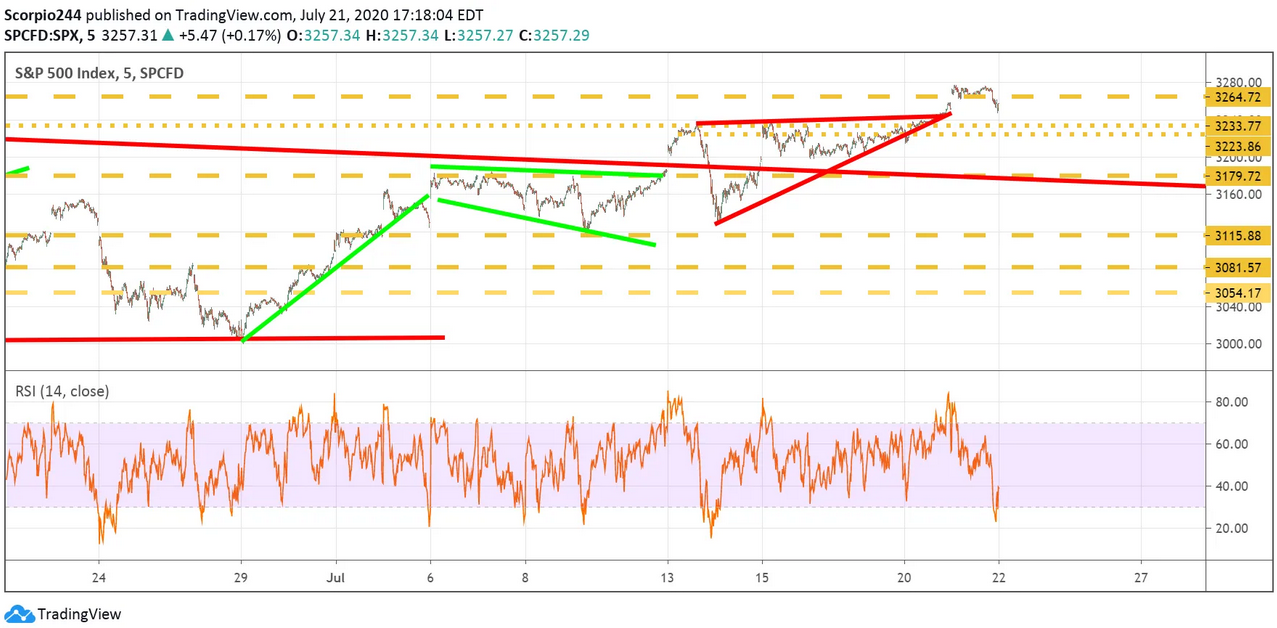
Stocks jumped on Tuesday, July 21, then fell. The volatility levels seem to be at extremes, even though they are not reflected in the VIX index. The S&P 500 had been up by around 70 basis points but finished the day up just 18 bps. Meanwhile, the NASDAQ 100 finished the day lower by 1%.

S&P 500 (SPY)

The S&P 500 gapped higher yesterday, and by day's end, that gap was filled. The index tried to break out, rising to as high as 3,275 but closed well short of it. At this point, we can say that the index failed to break out in that 3,265 region.
S&P 500 Index

NASDAQ 100 (QQQ)

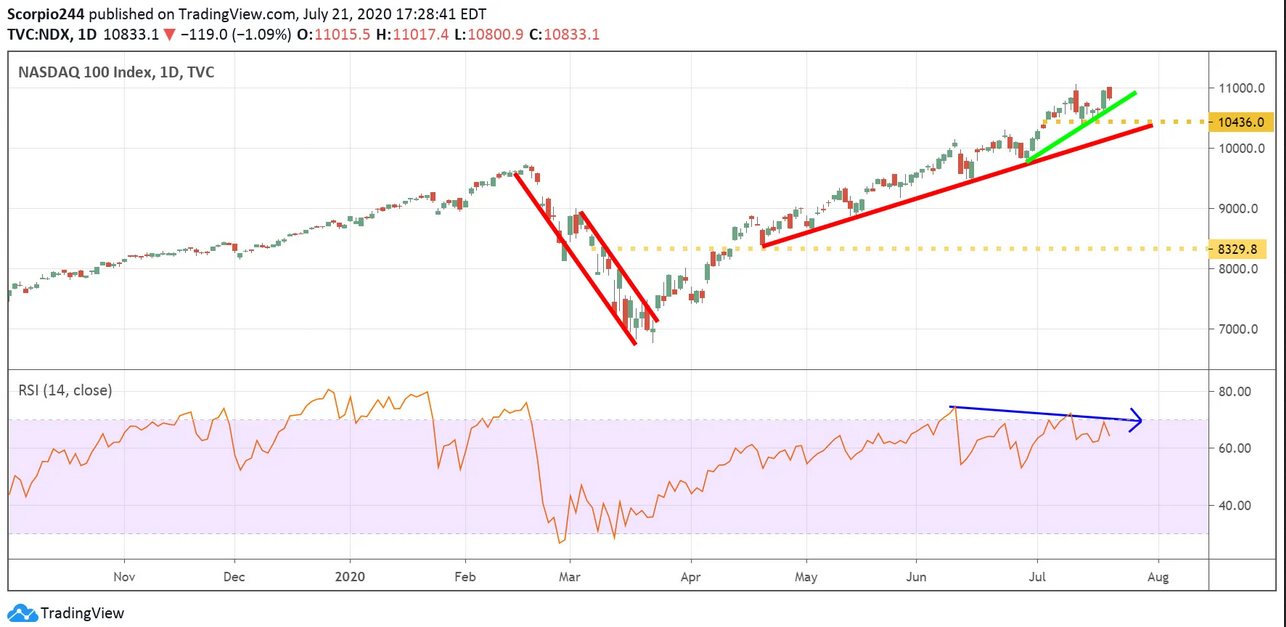
The big question, I’m sure everyone is wondering is if the NDX is forming a double top. The answer is that it is too soon to tell. The NDX would need to fall below that 10,400 level. There is the possibility that a bump-and-run pattern has formed in the index also. The RSI is trending lower now, and that is important to note.

Again, I continue to see bearish put buying in the Qs that suggesting there are plenty of people betting on the market's fall from here. I know it is hard to believe, but it is what it is.
Nasdaq 100 Index Daily Chart

Netflix

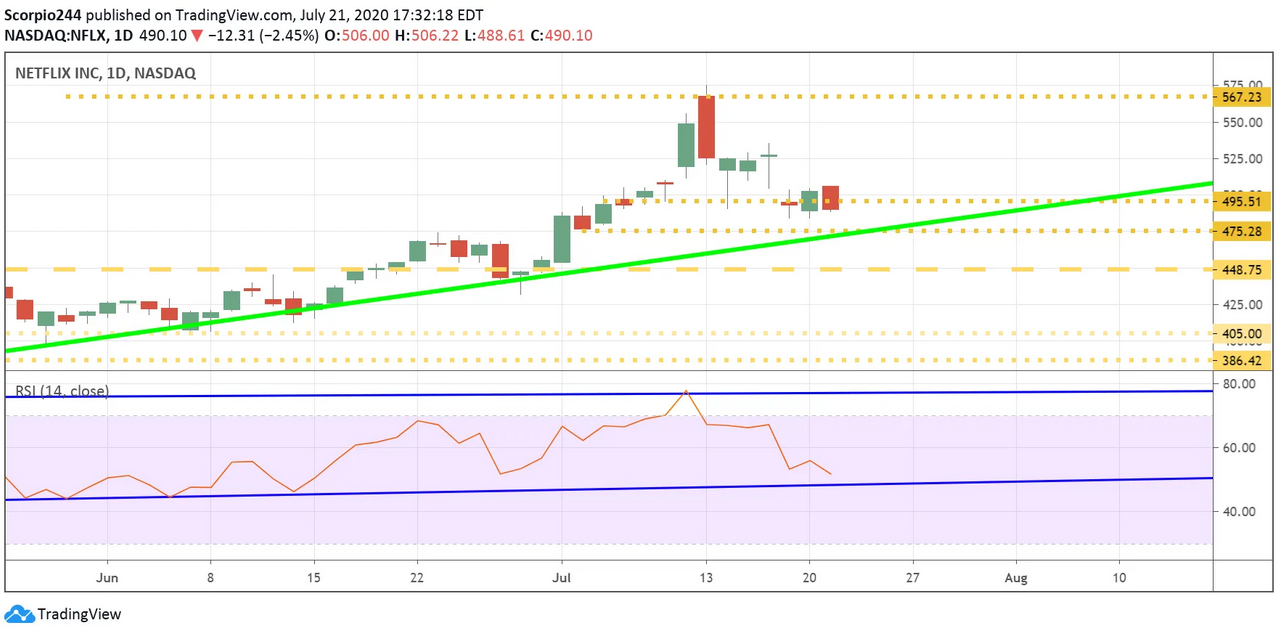
Netflix (NASDAQ:NFLX) broke through support today at $495. I happen to think $475 is next.
Netflix Inc Daily Chart

Nvidia

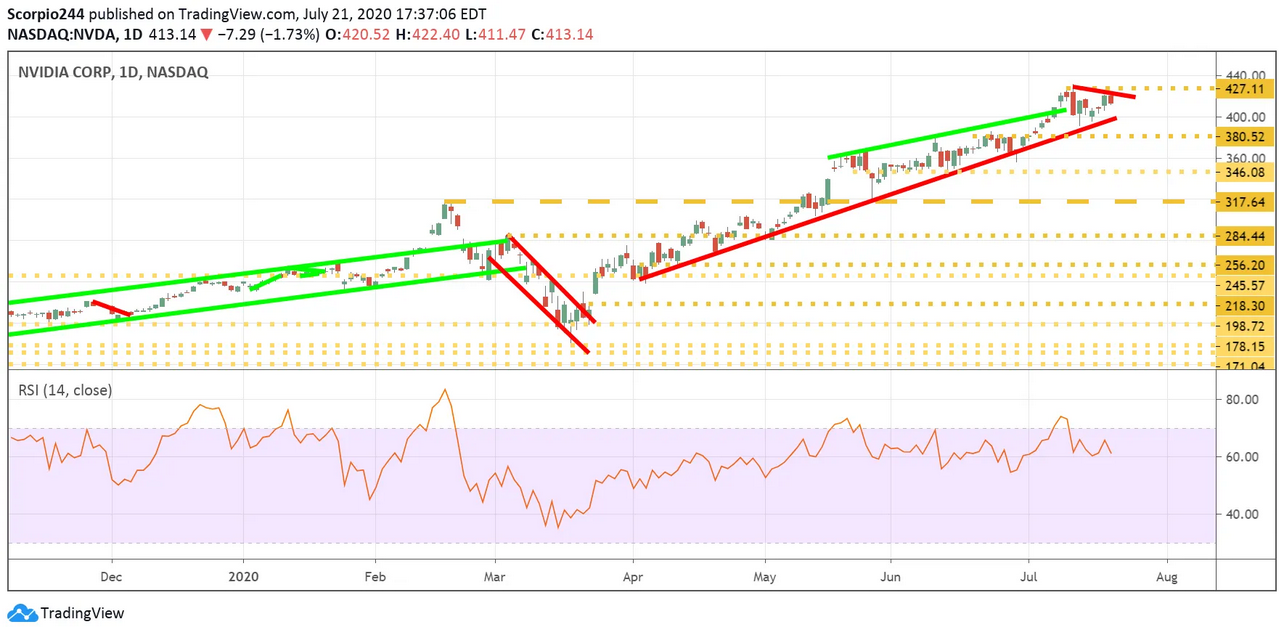
Suddenly NVIDIA (NASDAQ:NVDA) has a minor downtrend forming to match its declining RSI. No bearish options bets yesterday, but we have seen plenty in recent days.
3rd party Ad. Not an offer or recommendation by Investing.com. See disclosure here or remove ads .

NVIDIA Daily Chart

Apple

Apple (NASDAQ:AAPL) is very close to the uptrend now, a break of the uptrend would be terrible news for the entire market. The RSI is rolling over, $372 would be next.
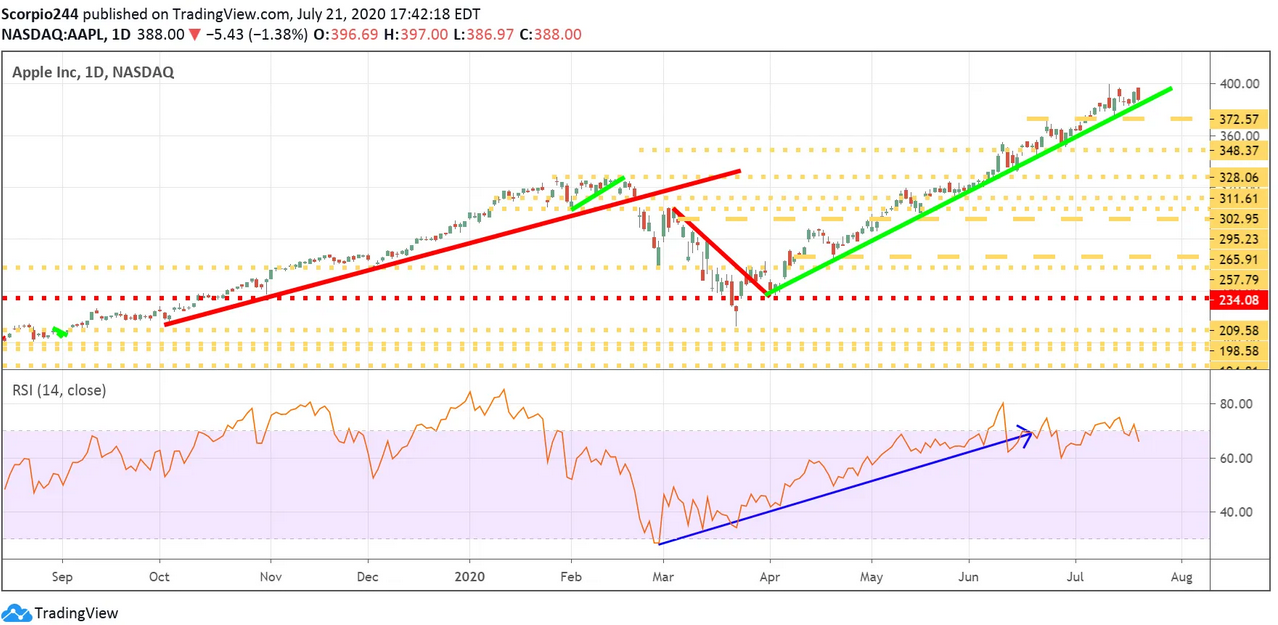
Apple Inc Daily Chart

SNAP

Snap (NYSE:SNAP) got hit hard; the company sees third quarter Daily Active Users in a range of 242 to 244 million, basically 243 million at the mid-point. That is shy of estimates for 244.8 million. There could be the making of a head and shoulders pattern there, with a break of $22.50 confirming the pattern. That would be a significant reversal.
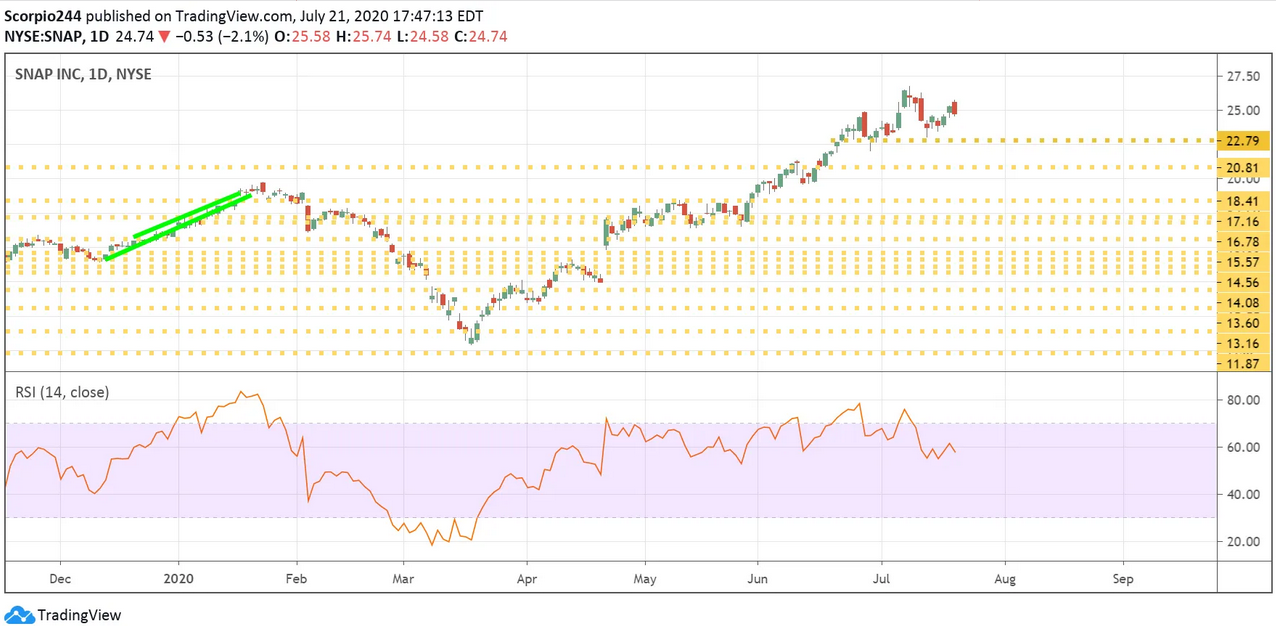
Snap Daily Chart

Tencent

I don’t know what you’ll be doing overnight, but I know I will be watching Tencent (HK:0700). Yeah, this thing has traced out Amazon’s performance nearly entirely. The stock was up 8% percent Monday night, and if you want to know where Amazon (NASDAQ:AMZN) is going today, you probably should be watching 700 HK.
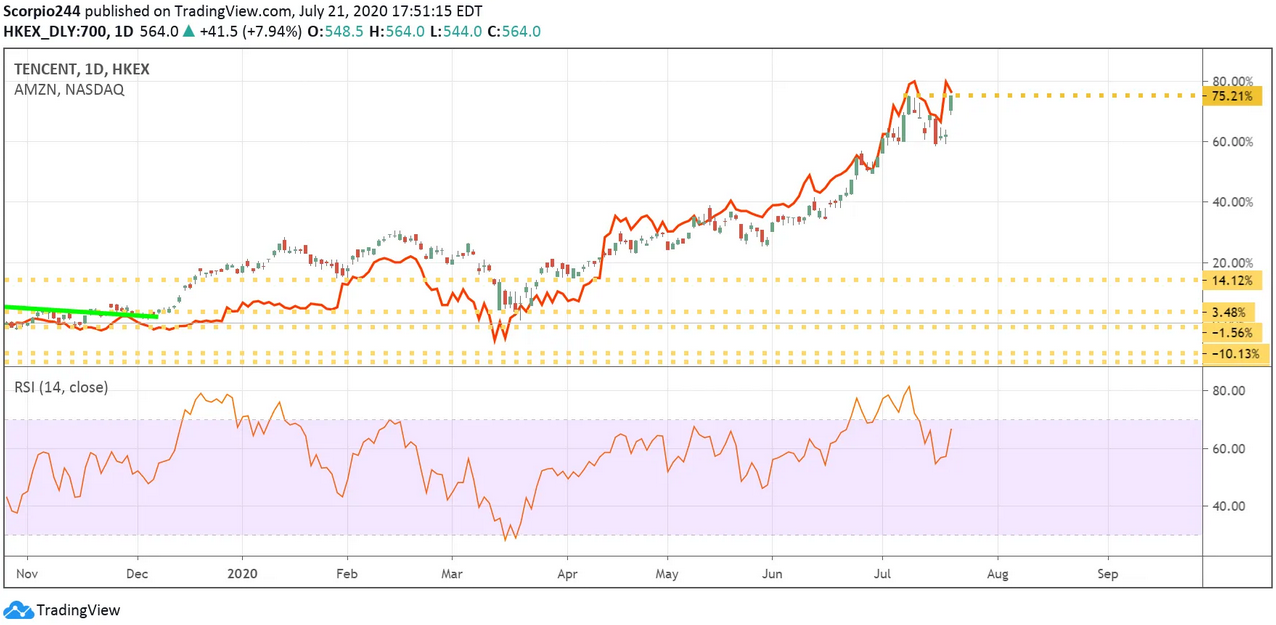
Tencent Daily Chart

A lot of potential double tops out there.

Original Post

Latest comments

You know what happened with all the double tops and h&s i found last week in the xlf and the xop? They rallied into oblivion. I dont trust chart patterns in this fed induced comatose market. Just like you said the vix hasnt even budged and it should!
what about docuSign, please?
Thanks Michael. Yes, def some double tops in tech, treading lightly. I think it’s cuz equities smell a vaccine (as if V1.0 would be safe, immediately/widely available, and >80% effective). Buying QQQ puts guards against a quick mean reversion trade with tech vs value (=reopening). But a vaccine would likely cause the Fed put to be phased out. So it’s possible the S&P could go nowhere, and the leaders would simply be more broadbased. No surprise that if you plot RPV (S&P value) vs IWM starting at the end of June, you will see nearly the exact same chart, except the RPV is maintaining a steady 4%-6% outperformance (offset). For now, RPV is a close proxy for IWM, but it’s a bet that uses sturdier chips.
Risk Disclosure: Trading in financial instruments and/or cryptocurrencies involves high risks including the risk of losing some, or all, of your investment amount, and may not be suitable for all investors. Prices of cryptocurrencies are extremely volatile and may be affected by external factors such as financial, regulatory or political events. Trading on margin increases the financial risks.
Before deciding to trade in financial instrument or cryptocurrencies you should be fully informed of the risks and costs associated with trading the financial markets, carefully consider your investment objectives, level of experience, and risk appetite, and seek professional advice where needed.
Fusion Media would like to remind you that the data contained in this website is not necessarily real-time nor accurate. The data and prices on the website are not necessarily provided by any market or exchange, but may be provided by market makers, and so prices may not be accurate and may differ from the actual price at any given market, meaning prices are indicative and not appropriate for trading purposes. Fusion Media and any provider of the data contained in this website will not accept liability for any loss or damage as a result of your trading, or your reliance on the information contained within this website.
It is prohibited to use, store, reproduce, display, modify, transmit or distribute the data contained in this website without the explicit prior written permission of Fusion Media and/or the data provider. All intellectual property rights are reserved by the providers and/or the exchange providing the data contained in this website.
Fusion Media may be compensated by the advertisers that appear on the website, based on your interaction with the advertisements or advertisers.
© 2007-2024 - Fusion Media Limited. All Rights Reserved.