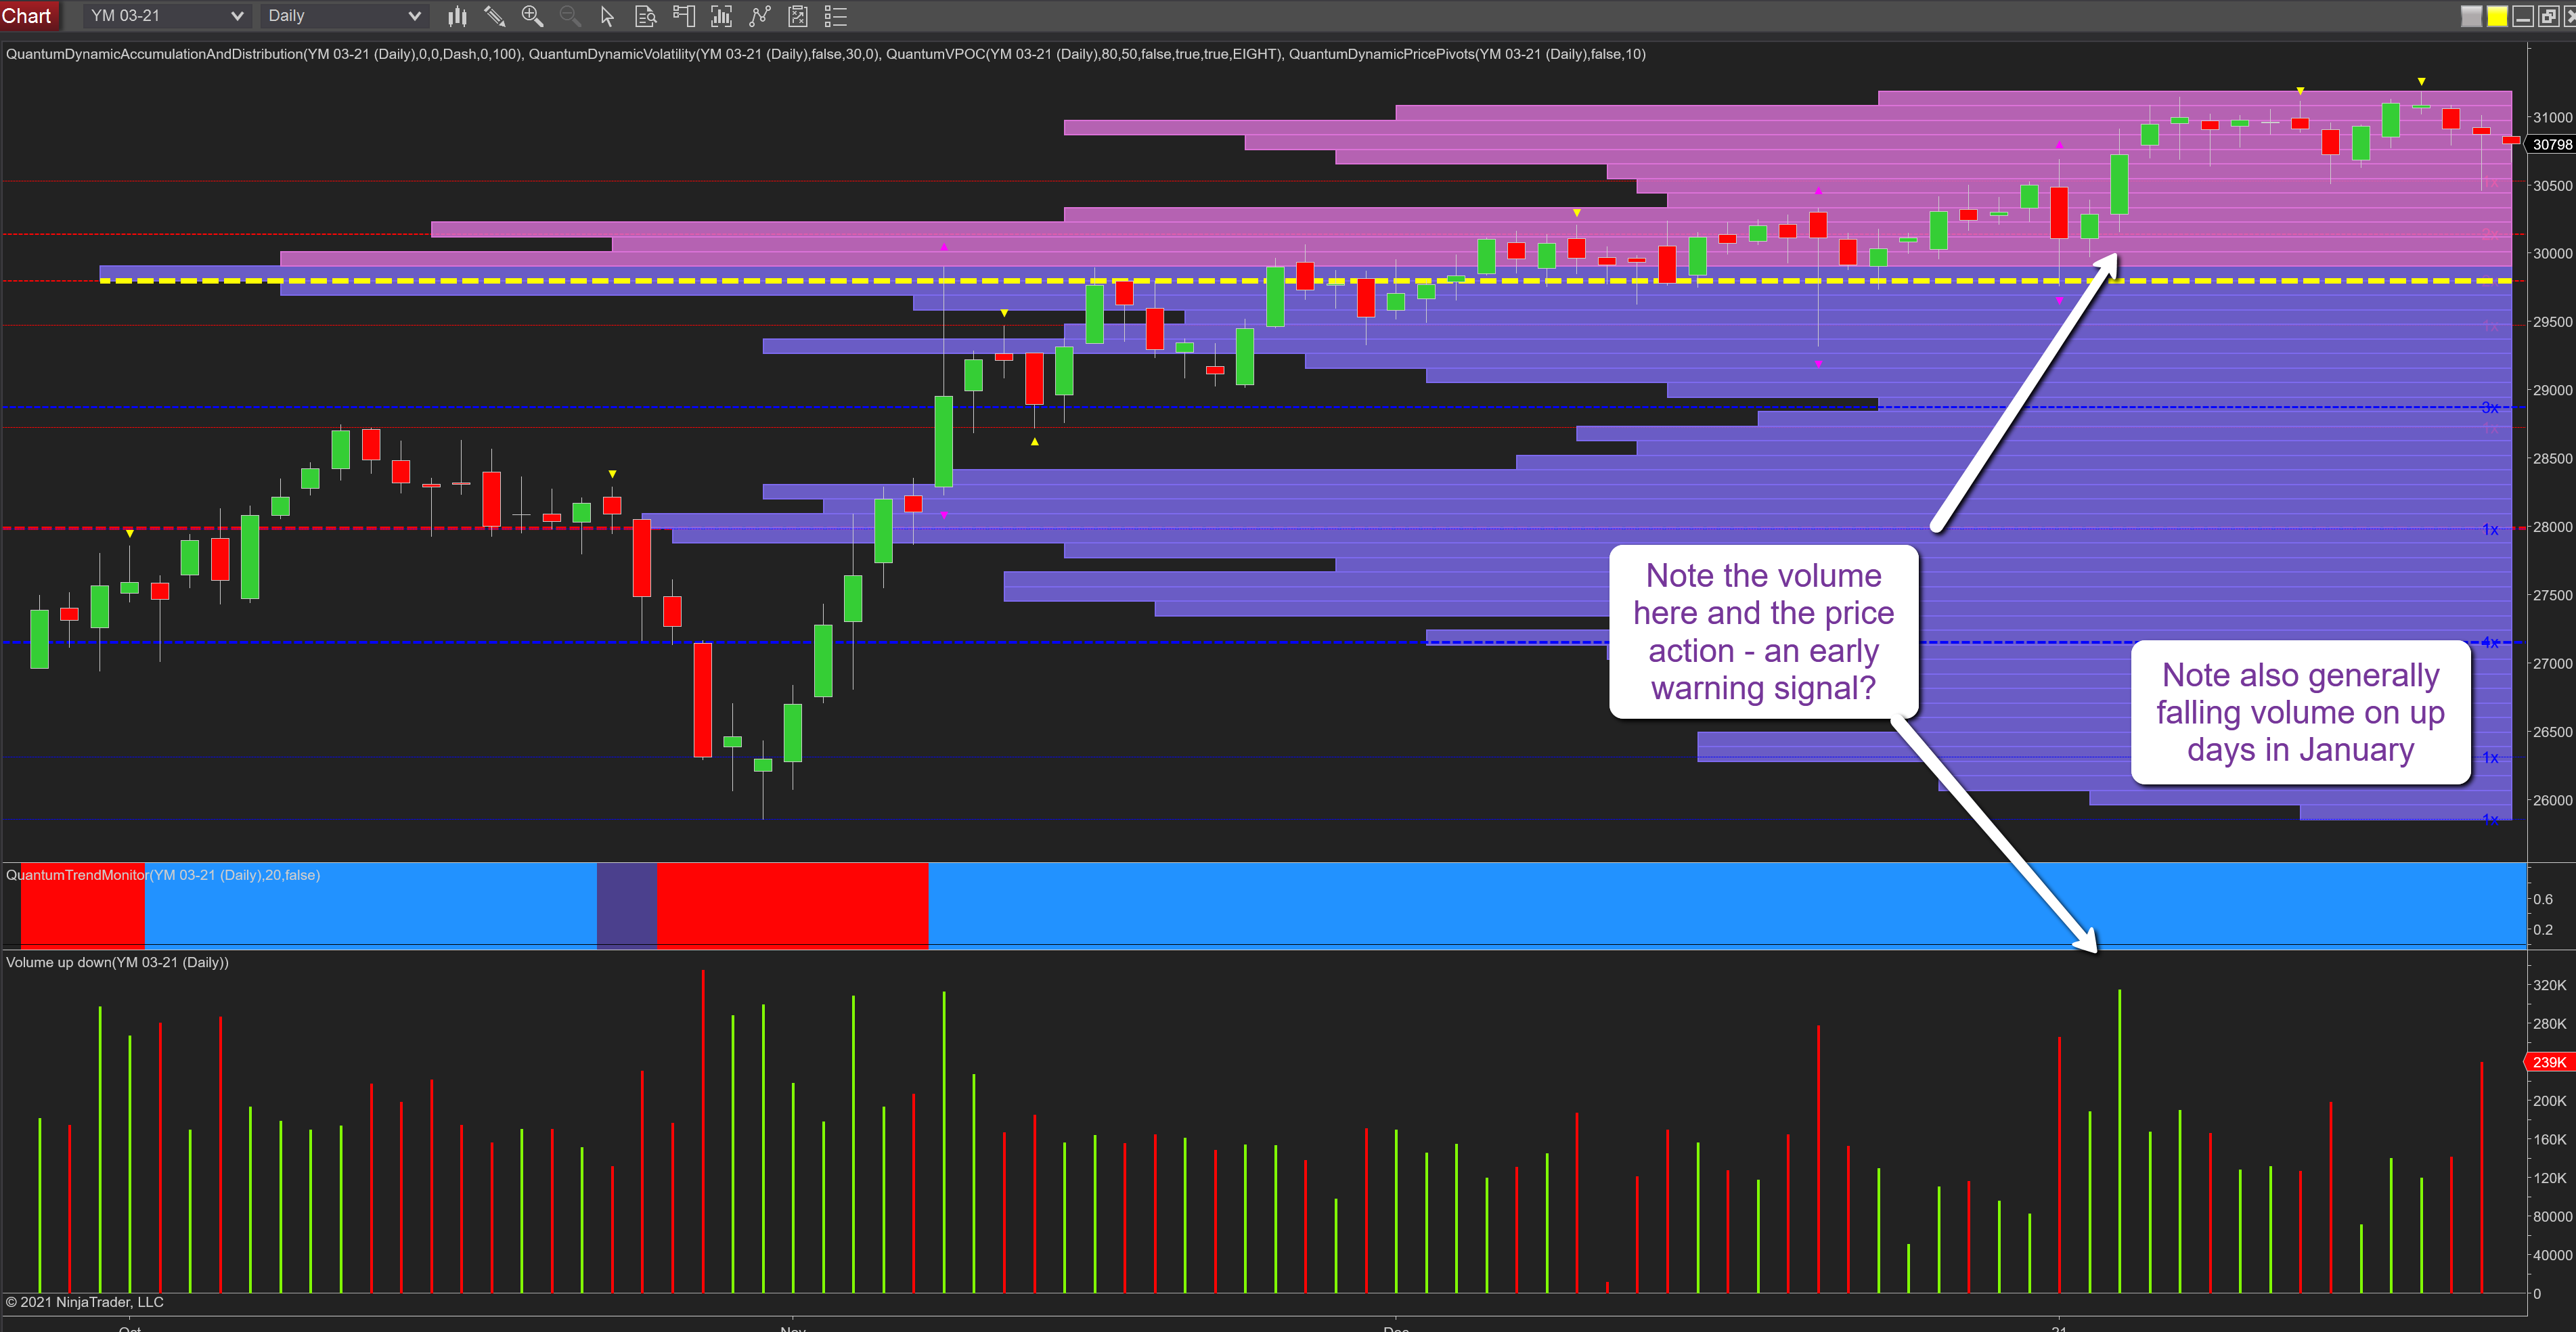
With the new President of the United States now firmly ensconced in the White House and the election dust settles, it’s interesting to see how the major U.S. markets are reacting, while remembering the pandemic is the dominant factor from a global risk perspective. Moreover, as we have seen over the last year, divergence is also commonplace across the three principle U.S. indices, with the Nasdaq 100 often moving in one direction, while the YM and ES move in opposition. Yesterday, however, was one of unity from the perspective of an intraday recovery that saw all three sell off sharply at the start of the session only to recover strongly and all on excellent volume as shown on the daily chart for the YM Emini with the NQ even closing higher than the open as tech stocks continue to buoy the Nasdaq 100. However, if we consider the chart for the YM Emini more closely, the same cannot be said for the Dow, which is flashing some worrying signals of a weakening in risk appetite.
Perhaps the most worrying signal was that of Jan. 6, where an injection of volume was delivered but which did not translate into a significant price move. This is a classic example of Wyckoff’s third law in action, in other words, effort and result. Here we have ultra-high volume and, as such, we should expect to see this reflected in a widespread up candle, yet the spread or range is comparable to other similar size candles that moved with half this volume. Hence, this is a clear anomaly and one that deserves our attention. The analogy here is of driving a car up a steep icy mountain slope, as more pressure is applied to the gas, the more the wheels spin until forward motion comes to a stop. It is the same here, with the buyers struggling against heavy selling from the market makers who are selling into weakness.
Next, if we compare the volumes of January on the up candles (this one excepted), volume is generally declining under the up candles but with the volume on down candles generally increasing. In addition, the spreads are also starting to narrow on any up days. All of this tends to point to a market that is both weak and fragile and now struggling to maintain the longer-term bullish trend.
However, what we have yet to see are those classic signs of weakness where we see a series of candles with wicks to the upper body giving a confirmation of this weakness. In other words, the inverse of yesterday’s price action.
Finally, it is interesting to note the pivot signals, the two yellow triangles, now appearing around the 31,000 level and adding their own brand of potential weakness to the chart. While the recovery yesterday was a welcome one for the bulls, this morning’s gapped down open, albeit limited, is hardly a sign of strength.
