Micron surges after one of the biggest beats in U.S. semis history
Summary
The Consumer Staples Sector (XLP) is definitely out-of-favor right now.
But standard late-cycle sector rotation informs us that this is a sector to add near the end of a rally.
Four of the ten largest components of the XLP are trading at/near 52-week lows, while also having attractive yields and strong cash flows.
Consumer staples stocks are decidedly un-sexy. How can you get excited about diapers? Or toothpaste? Or cleaning supplies? The sector is also dominated by some of the largest companies on the S&P 500, which means that a realistic growth expectation for these companies is the current rate of GDP growth, nothing more. There's little chance for radical M&A or paradigm busting activity. Instead, these companies are more than likely to exhibit "more of the same" management styles.
Yet their predictability is also a strength. Investors know exactly what they're buying when they purchase these companies and are right to expect consistency in performance and management styles. And because these companies sell "staples," they're more insulated than their other, sexier equity brethren should the economy experience a contraction. This is why a general sector rotation investment strategy moves to consumer staples during the latter part of an expansion, which is about where the US economy is right now.
Moreover, staples are horribly out-of-favor right now:
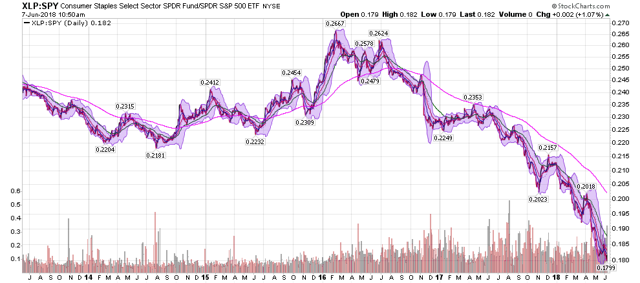
The above chart plots the XLP/SPY relationship, which is currently at/near a 5-year low - perfect for a contrarian play.
And the daily and weekly charts are also attractive:
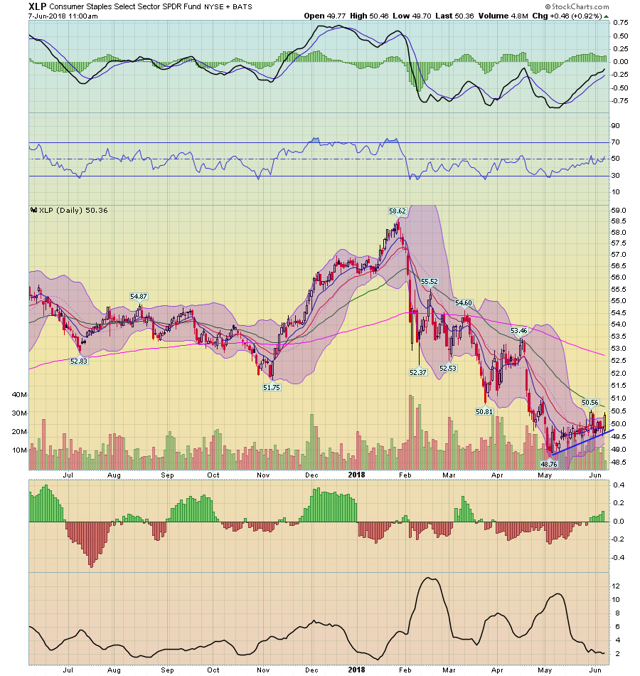
While the daily chart recently hit a 52-week low, it's been moving modestly higher since the beginning of May, forming a solid uptrend. Prices are right about the 10 and 20-day EMA with rising momentum.
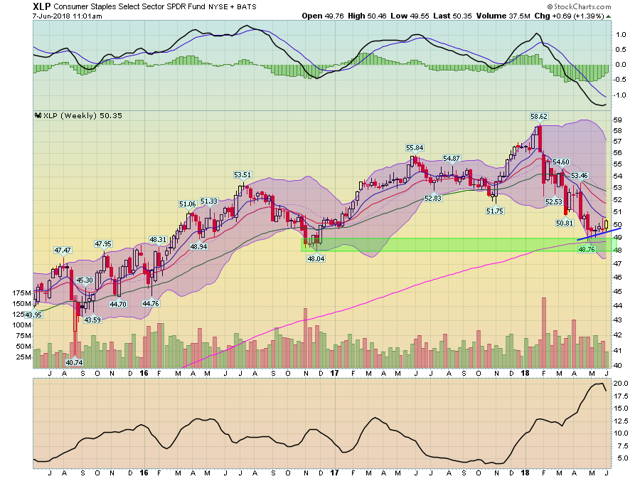
On the weekly chart, prices are right above the 200-week EMA as well as price support established at the end of 2016 (the green rectangle). Momentum is slowly turning.
Next, let's look at the ten largest members of the XLP:
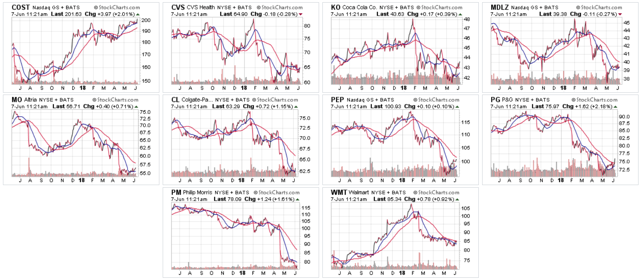
With the exception of Costco (NASDAQ:COST) (top row, far left) and Walmart Inc (NYSE:WMT) (bottom row, far right), all the largest components are at/near 52-week lows. Let's dig a little deeper into this group of 10 stocks, looking at dividend yields, PEs, and forward PEs:
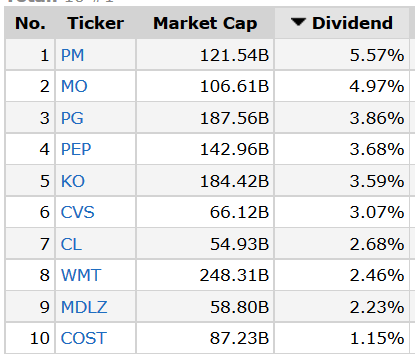
Six companies are yielding over 3% (which is at/near where the 10-Year Treasury is currently trading). Both Costco and Walmart (see discussion above) are below that level.
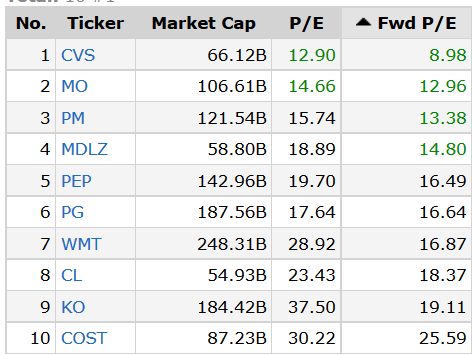
The overall market is currently expensive by a number of standard cost measures, making an organization based on forward PE more appropriate. CVS, MO, and PM are all traditionally lower PE stocks. Colgate and Coke are a bit too pricey on a forward basis.
That leaves us with a list of five potential stocks: CVS, MO, PM, PEP, and PG. The main thing I want in these stocks is incredibly strong cash flow such that the company has the ability to not only finance current operations but also dividends and/or stock buybacks.
CVS
CVS is primarily a pharmacy company, having both retail and pharmacy benefit operations. According to their latest 10-K:
Through more than 9,800 retail locations, more than 1,100 walk-in health care clinics, a leading pharmacy benefits manager with more than 94 million plan members, a dedicated senior pharmacy care business serving more than one million patients per year, expanding specialty pharmacy services and a leading stand-alone Medicare Part D prescription drug plan, we enable people, businesses, and communities to manage health in more affordable, effective ways.
Here's their cash flow statement showing their last five years of activity:
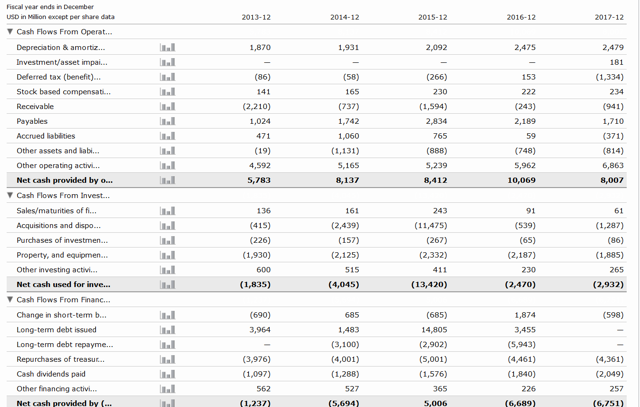
From Morningstar.com
This is a great cash flow statement for conservative investors. With the exception of 2015 (when they made an $11 billion acquisition), they've had sufficient cash flow to fund investments. That gives them plenty of financial room to pay dividends and buyback stock; they've done both. Since 2013, they've purchased $21.8 billion in stock and paid $7.8 billion in dividends, which they've increased for the last 10 years.
The chart is attractive:
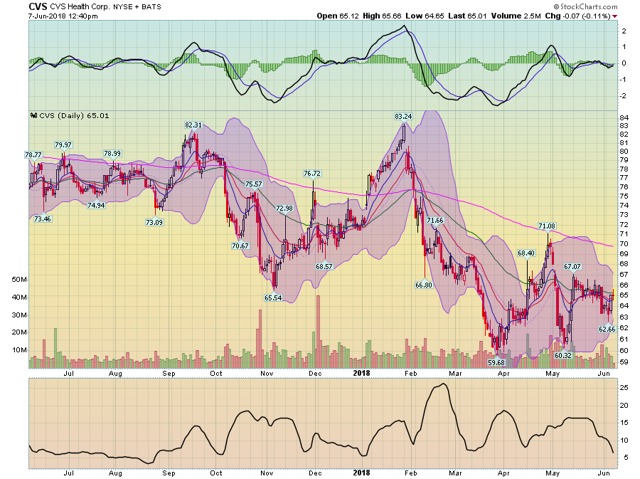
CVS is trading near a 52-week low.
MO or PM?
There are two tobacco companies on the list. While Altria is yielding about 50 basis points less, they are still buying back stock, which makes them a bit more attractive. However, MO they're still a good company to look at right now.
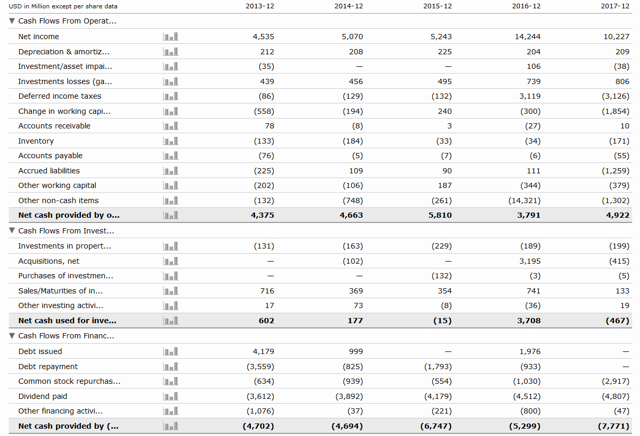
There's pro and con with Phillip Morris (PM). On the con side, they're a tobacco company, which some investors may find objectionable for ethical reasons (if so, please don't add this to your portfolio). On the plus side, this is a company that literally prints money:
From Morningstar.com
With the exception of 2015 (when they made an acquisition), (MO) has had more than enough cash left over after making investments to distribute to shareholders. And they have, purchasing slightly more than $6 billion in stock and paying out $21 billion in dividends. This is a company that more than adequately compensates shareholders for owning their stock.
They are currently trading near a 52-week low:
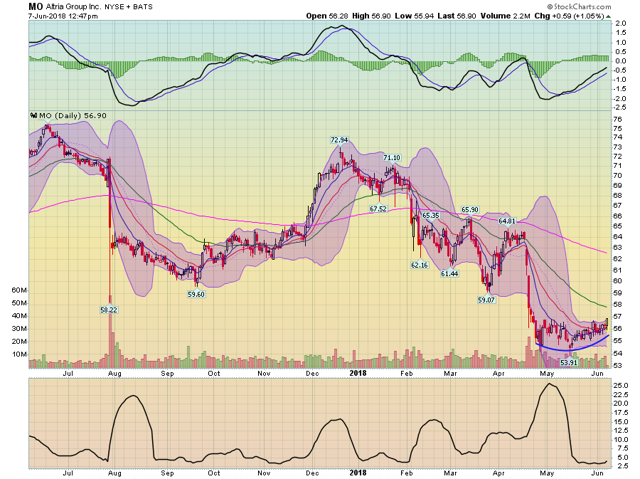
Prices are forming a rounding bottom formation with rising momentum, which is potentially a bullish development.
PEP
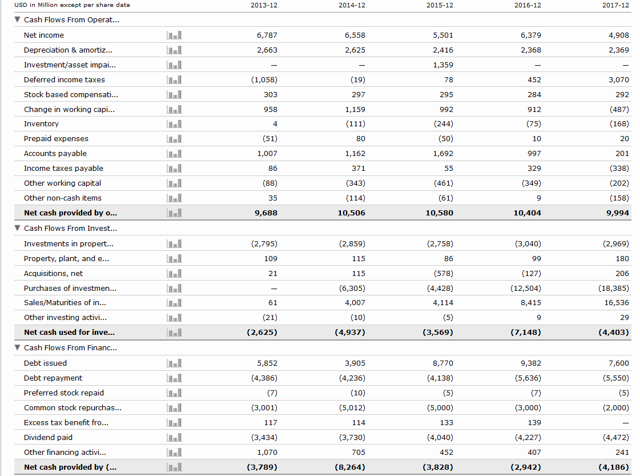
It's hard to go wrong with Pepsi (PEP). The company owns many iconic US brands - most of which you'd buy for party snacks. And, they have a great cash flow statement:
From Morningstar.com
In the last five years, the least amount of cash they've had on the books after investments is $3.2 billion - a tidy sum. In the last five years, they've purchased a little more than $18 billion of their stock and paid out almost $20 billion in dividends. On top of that, they've a dividend aristocrat, having raised their dividend for 45 consecutive years.
And the stock is technically attractive:
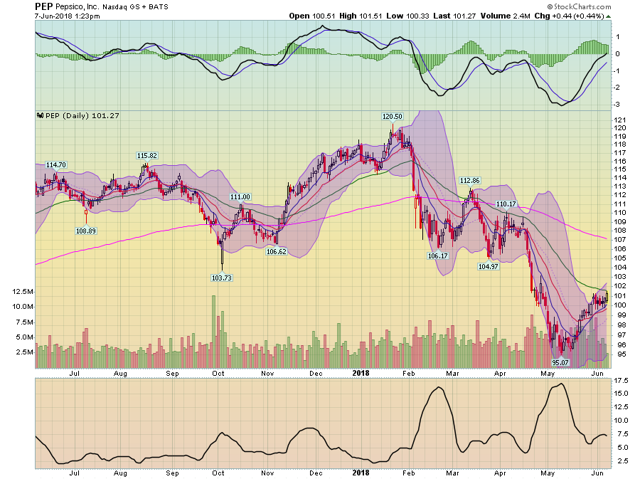
The stock recently made a 52-week low but has been rallying since. Momentum is rising and prices have moved through the 10 and 20-day EMA.
PG
I have a personal bias for this company. I was born in Cincinnati, Ohio, where they have their global headquarters. And they are good corporate citizens of the city. Even after considering their current downsizing, they are still the owner of numerous brands that consumers just can't live without.
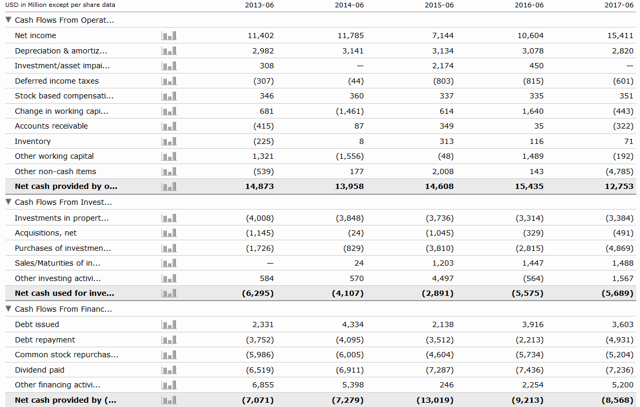
And, as with the other companies on this list, they have a wonderful cash flow statement:
From Morningstar.com
As with the other three companies, (PG) literally prints cash. Despite all of the issues related to their ongoing reorganization, the least amount of cash they had left-over after making investments was $7 billion in 2017. And, they used that money to reward shareholders: over the last five years, they've paid a whopping $35.3 billion in dividends and purchased $27.5 billion in stock.
And on top of that, the stock is very attractive from a technical perspective:
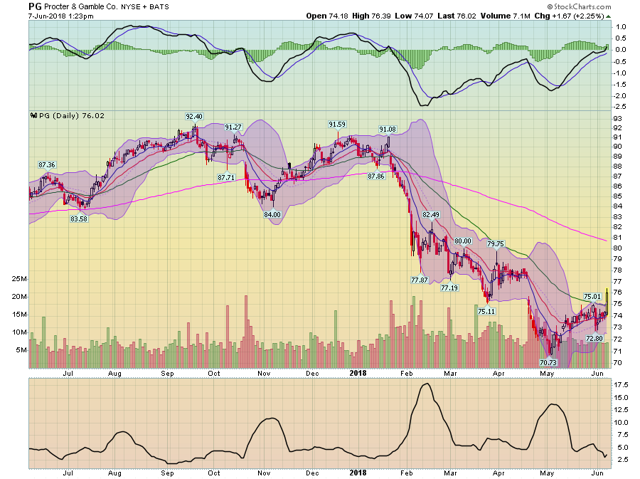
The stock recently made a 52-week low. But it has been moving modestly higher since the beginning of May and printed a solid move higher on Thursday.
So, if you want to add some consumer staples to your portfolio, now is the time. And the four issues mentioned above are trading at 52-week lows and have tremendous cash flows. These are stock to consider.
This post is not an offer to buy or sell this security. It is also not specific investment advice for a recommendation for any specific person. Please see our disclaimer for additional information.
Disclosure: I am/we are long PG, PEP.
I wrote this article myself, and it expresses my own opinions. I am not receiving compensation for it (other than from Seeking Alpha). I have no business relationship with any company whose stock is mentioned in this article.
