Today Goldman Sachs announced that commodities were poised for a bull market.

We have taken advantage of that bull market for quite some time now.
We’ve seen nice moves from hard to soft commodities, which we are currently still holding.
But, what alerted us to this trend and are there still great areas to profit from?
The pandemic jump started the initial surge in hard commodities as investors flocked to safety plays, like gold and silver.
Then, disruption in the supply chain led to the eventual rise of soft commodities such as the DBA, CORN, and more.
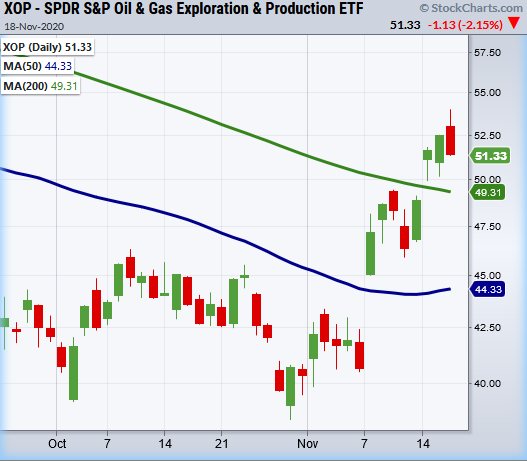
Now, while there are still great investment opportunities in soft commodities, the oil and gas exploration sector looks to be gaining motion.
Currently, a large amount of commodity ETFs are sitting in a bullish phase.
A bullish phase is defined by the price of a stock/ETF sitting above the 50 day moving average with the 50-DMA above the 200-DMA.
Not quite bullish, the oil and gas exploration sector has just entered an accumulation phase.
The definition for this phase is when the price is over the 200-DMA, but the 50-DMA is under the 200-DMA.
With the current market run we have seen lots of movement of goods as the transportation sector (IYT) has again made new highs today breaking Tuesdays high of 219.91.
With the market comeback from March lows it’s only fair to share some of those profits with a key underlying supporter of transportation.
That's where (XOP) comes in.
Though it’s taken longer to perk up, if it can hold over the 200-DMA this looks to be another good sector to keep an eye on.
Of course, a lot will depend on the virus surge, businesses shutting down or not, and what we saw resurrected today, stimulus talks.
If folks head back home with uncertainty replacing hope, energy once again, will be impacted.
This is a market for the very nimble!
S&P 500 SPY Since it never cleared the high from a week ago, we could say the topping pattern remains until 364.38 clears.
Russell 2000 IWM Made a new high and reversed. If it closes under 175.86 Thurs, could see support from the 10-DMA at 171.59 and if can’t hold 168.34 next.
Dow (DIA) If can’t hold 292.68 then watch for last weeks low at 289.19
NASDAQ (QQQ) NVDA sold off after hours, while this is already under pressure with 280 key support
KRE (Regional Banks) Another nagging reversal candle if confirms. Support at 45.16.
SMH (Semiconductors) Needs to clear 202.89 with support at 190.
IYT (Transportation) Like IWM, new highs then reversal if fails 218 on a closing basis
IBB (Biotechnology) 136.57 support the 50-DMA and 143.36 Resistance.
XRT (Retail) Ditto here like IWM and IYT. So Spiderman is out of webs for today
