Oracle stock jumps 5% on TikTok deal progress, OpenAI fundraise talks
DAILY
Intel (NASDAQ:INTC) produced another good number on the earnings report few days ago (last quarter did well also), but investors have been, bit, skittish, on this stock as we've seen much of volatility pretty much all year long.
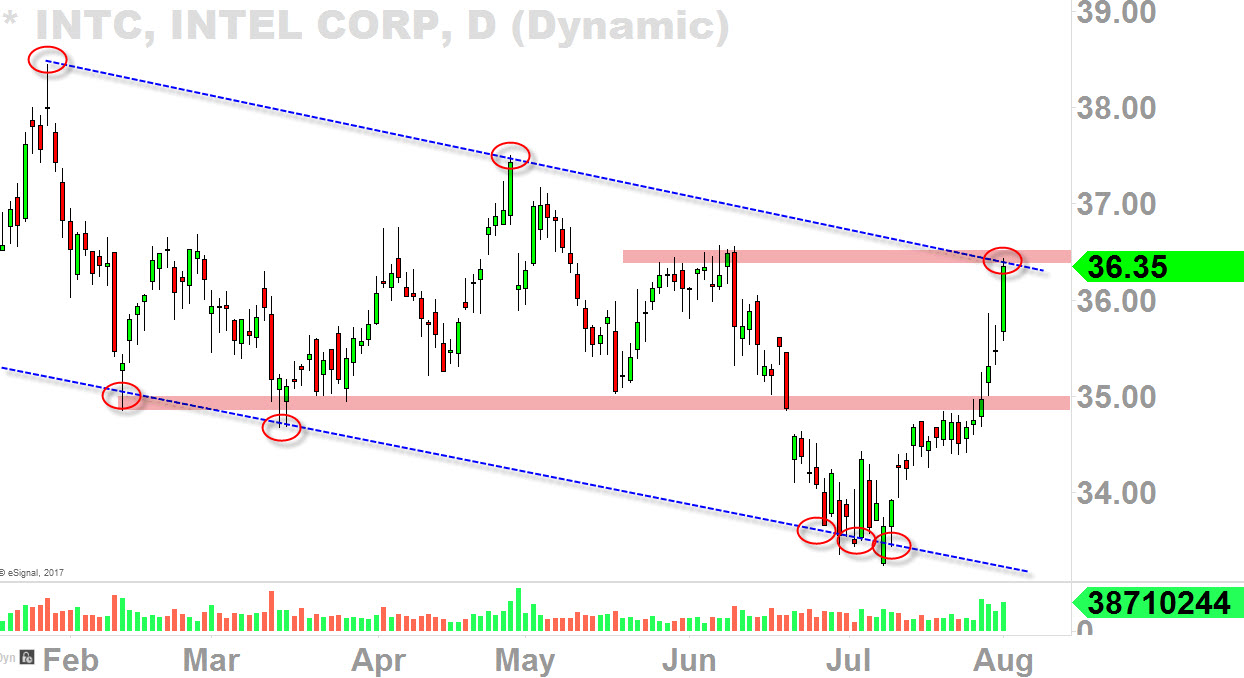
On July 21st, it seemed as though bottom fell out as it broke major support at 35ish (as you can see in the chart below).
Well, the market knows that everyone has their stop-loss placed just under that level and 'the house' needs to take those stops out to take money from longs and shorts as many would might even start to short this stock after the falling below that 35-support.
I've tweeted out on July 21st that, that's what the market tends to do it will shake the weak hands "before a major reversal."
But it wasn't easy to hold as the earnings were approaching quickly on July 27th as the price was back at the prior major support level at 35.
I've tweeted out on that day (July 27th) that, "I will be holding all of my positions" that night. I don't have the crystal ball and I sure didn't know the outcome-but you know, that's a life of a trader, sometimes you just have to hold through the turbulence.
Numbers were good and the stock was up, after hours, as high as +6%, but investors old habit kicked in and fear loomed yet again as the price starts to retrace.
As you can see in the chart below, multiple long wicks right on that 35-level.
Well, today, buyers prevailed and finally stretched its wings, but we are now trading right underneath the falling resistance (dotted blue) coinciding with horizontal resistance (red) in this multi-month falling-channel range.
So now, the question remains, will it fall back down to the bottom of this channel at 33ish, or will it hold before getting above this strong resistance at 36.50ish.
Should the price fall back, I would want to see 35-level hold to as new support possibly forming inverted H&S pattern (5/17/17 low being left shoulder) and then break above this falling resistance at 36.50ish.
Another scenario might be, we just penetrate right through it or gap it up and breakout of this range one for all.
Well, let's see how it plays out, but like I've talked about on my last video, I would rather be in INTC than NVDA.

Monthly
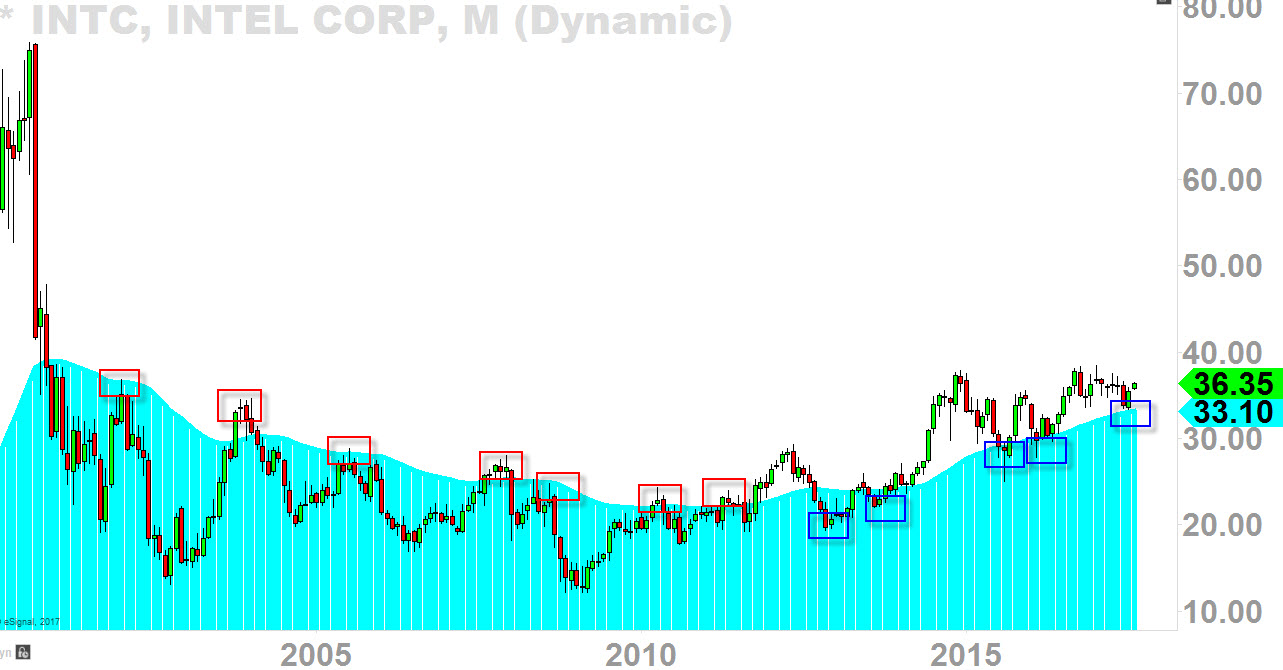
This long-term chart shows us that INTC has been building base for 17-years, and bigger the base bigger the move.
I am still very bullish on INTC for the long-term anticipating ATH+ price target possibly within few years.
In the below chart, red boxes represent downtrend phase, and the blue boxes represent uptrend phase.
And because we are in a primary-term uptrend (not downtrend), it didn't come all the way down to cultivate new lows, it stopped short and cultivated higher low as you can see the last blue box on the right.
I am still holding sizable positions on INTC.
- at 33.38: Entered Calls (LEAPS) on 11/4/16
- at 37.60: Closed 1/3 Calls (LEAPS) on 1/24/17
- at 35.51: Added More Calls (LEAPS) on 2/9/17
- at 35.05: Bought SHARES on 3/15/17
- at 36.21: Bought More SHARES on 4/28/17

