The nominal CMT yield on the benchmark 10-Year US Treasury note hit its low on July 8 last year. It’s debatable, of course, as to what turned it around; I think “reflation” from there began in Japan and all those whispers of the “helicopter.” It didn’t really matter that the BoJ didn’t really consider the proposition, what did instead was the hope that all central banks finally realized their futility and would turn to something else, anything else up to and including the sensational.
In those nominal terms, this third “reflation” selloff in UST’s lasted 176 trading days. It appears to have ended on March 13, 2017, a real slap in the face of the FOMC who two days later voted for the third of the so far four “rate hikes” (true RHINO, rate hikes in name only).
The second “reflation” began on May 3, 2013. Its origin is not really up for debate. Bernanke told Congress that the FOMC was considering a taper of QE3 (and QE4) even though it was supposed to have been open-ended and at that point was a mere seven months into its purchases. The bond market after being cautious in its approach to this QE, sold off believing that if the Fed believed in the economy to go so far as to consider tapering there was no point sticking around for when interest rates had nowhere to go but up.
The ultimate peak for the 10s was registered on the last trading day of 2013, a span of 172 trading days. There are marked differences between that one and this one, but you cannot help at times but get the sense that these things are really just repeating.
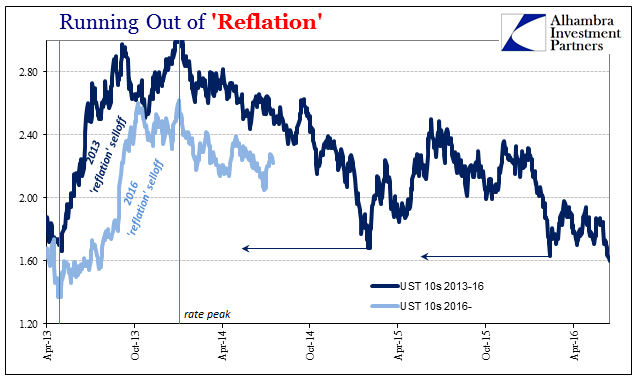
Along those lines, economists again can’t fathom why the Fed seems to be so irrelevant. What halted “reflation” ultimately in 2014 was the same as has stopped it again; bond investors stopped listening to the Fed. If Bernanke’s Fed seemed almost eager to taper the last QE’s in the second “reflation”, Yellen’s Fed is in much the same rush to do her regime’s equivalent (exit). And in both circumstances they proceeded despite often glaring contradictions to their bubble-built consensus (that rested each time largely on the unemployment rate).
Despite so many similarities, it may ultimately prove to be the differences that matter most. Nominal rates at the short end may be higher today than in 2014, but all that means is that the yield curve is even more condensed now in comparison. Curves matter more than nominals, as it is the curve that tells you what you need to know because that is where money is used or not. These curves, moving toward new compressed levels against “reflation” #3, are already back at last summer levels; even the BOND ROUT last associated with Mario Draghi’s first positive comments is a round trip distant memory.
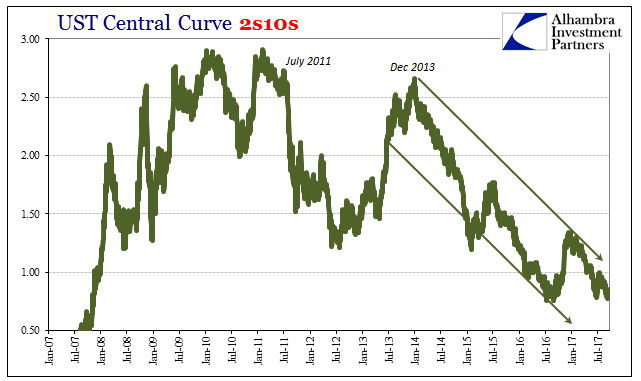
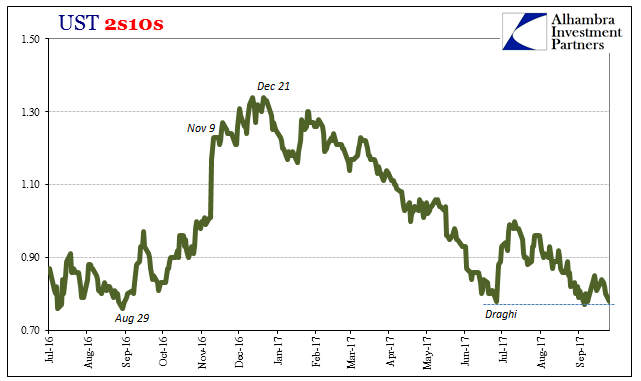
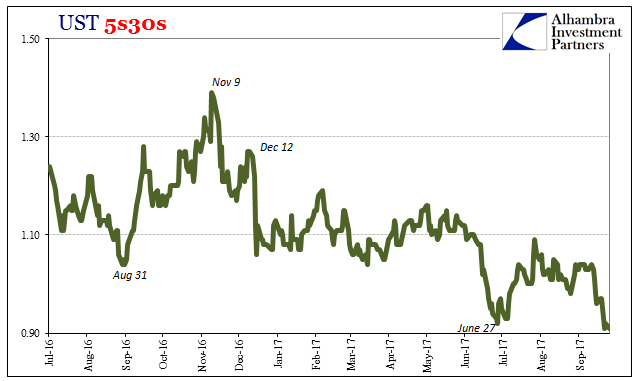
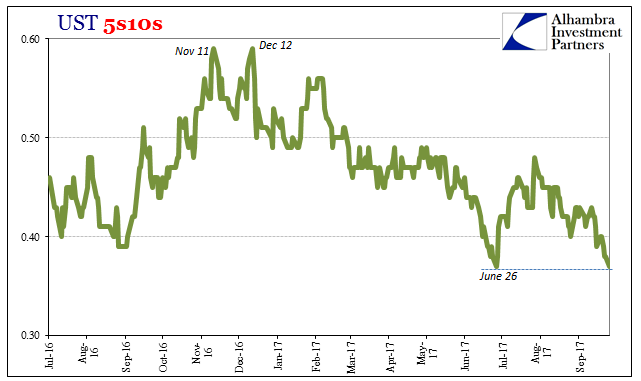
Economists will struggle with all this because they look at the bond market backwards. It really is very simple. The Fed at most changes the short-term frame of reference. That’s it. Orthodox theory posits that is a significant thing when a few decades of practice empirically establishes that it is not.
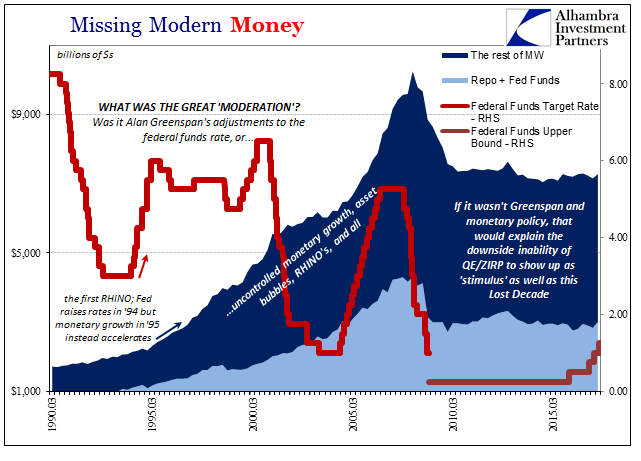
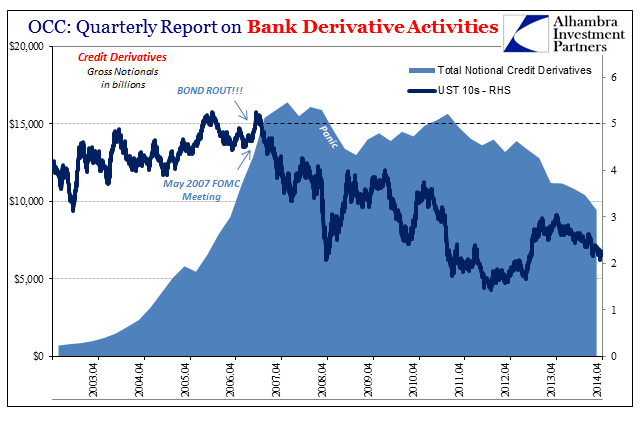
The reason for that is more profound. Credit default swaps in the middle 2000’s provide a useful anecdote for why. The Fed “raised” the federal funds target rate 17 times from June 2004 to June 2006, and yet there was hardly any trace of “tightening” in money markets. There was instead every indication of the opposite.
Does it really matter than in May 2004 you could borrow at 1% in federal funds unsecured that you could only get at 5.25% in July 2006 and after? It seems like it should matter, maybe even a great deal.
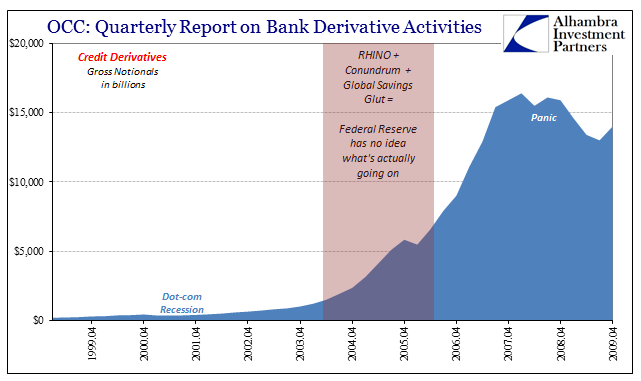
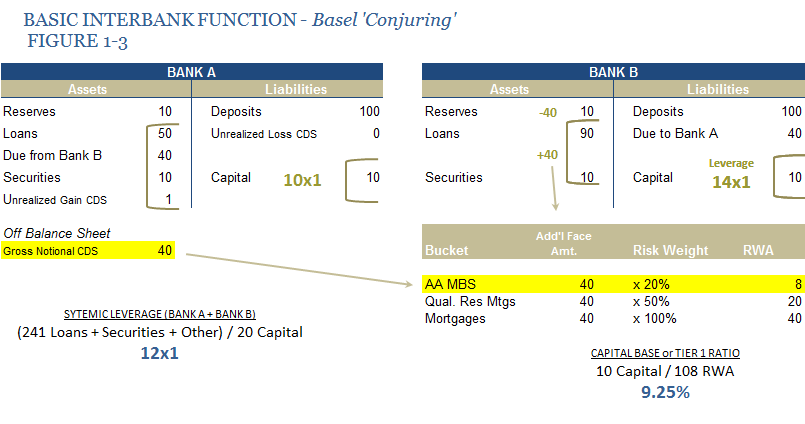
That’s not how balance sheets were/are constructed, however. The cost of such funding is but one input among several primary variables. If you can find cheap CDS available almost anywhere to change the risk bucket RWA calculations of your assets to make your balance sheet exponentially more efficient, then the cost of unsecured funding is almost immaterial (I would argue that in many cases it wasn’t “almost”). In that situation, you pay whatever the funding rate on huge volume regardless, making money by volume and size expansion rather the short/long spread theorized for traditional banking.
Thus, when the Fed was forced to reduce the federal funds rate after August 2007, it had no outward effect, either. The sudden and large disruption in CDS at the same time did, profoundly (and permanently) so.
What the yield curve tells us right now in relation to last summer, or even three summers ago, is that nothing has changed. Liquidity preferences remain the primary monetary consideration because the Fed still sticks with its 1960’s view of the 1930’s; and the (global) system is afforded no such academic luxury. That means we keep repeating the same thing over and over; everyone gets (briefly) excited that something might change, only to be disappointed that it doesn’t (can’t) really.
