
On Apr 11, 2019, the price of Litecoin reached an hourly high of $88.47 and €78.73. Price has been since trading along a gradual downtrend.
Significant spikes and drops have been seen in the process:

After new lows were reached on Apr 21, Litecoin’s price began another upward movement. Will Litecoin reach a peak soon or can we expect greater gains?
Let’s find out:
Litecoin (LTC): Trends And Highlights For April 23, 2019
- Both LTC/USD and LTC/EUR have been on a downtrend since Apr 11.
- Litecoin is trading inside a descending channel.
- The price previously broke out from an ascending wedge.
- There is resistance near $87/€80.
Descending Channel
The price of LTC/USD on Bitfinex was analyzed at one-hour intervals from Apr 11 to Apr 22 to determine the current trading pattern. We do not include euros in this section because only one trading pair is needed to generate the current trading pattern. Both LTC/USD and LTC/EUR are discussed in the final two sections.
On Apr 11, the price reached an hourly high of $85.50. Several market cycles have been completed. Highs have grown subsequently lower each time. the price has made lower highs each time.
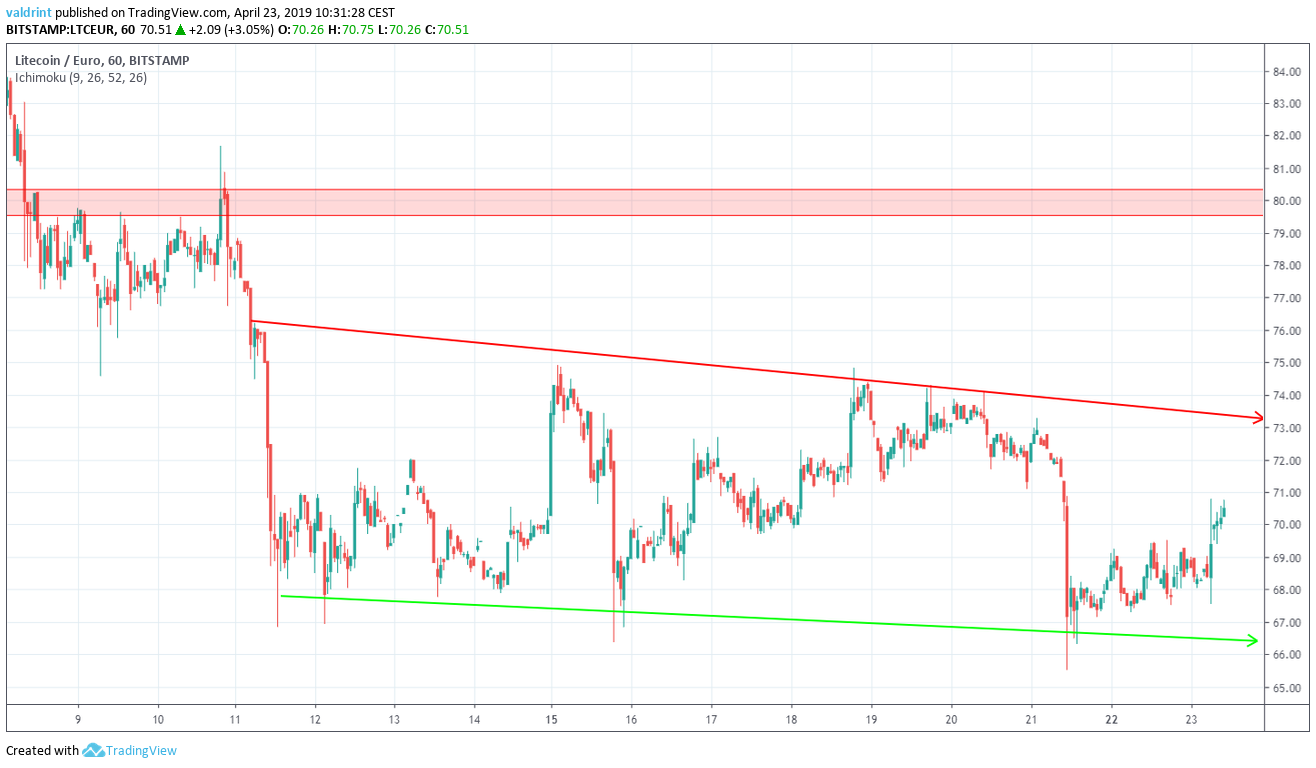
Tracing these highs gives us a descending resistance line: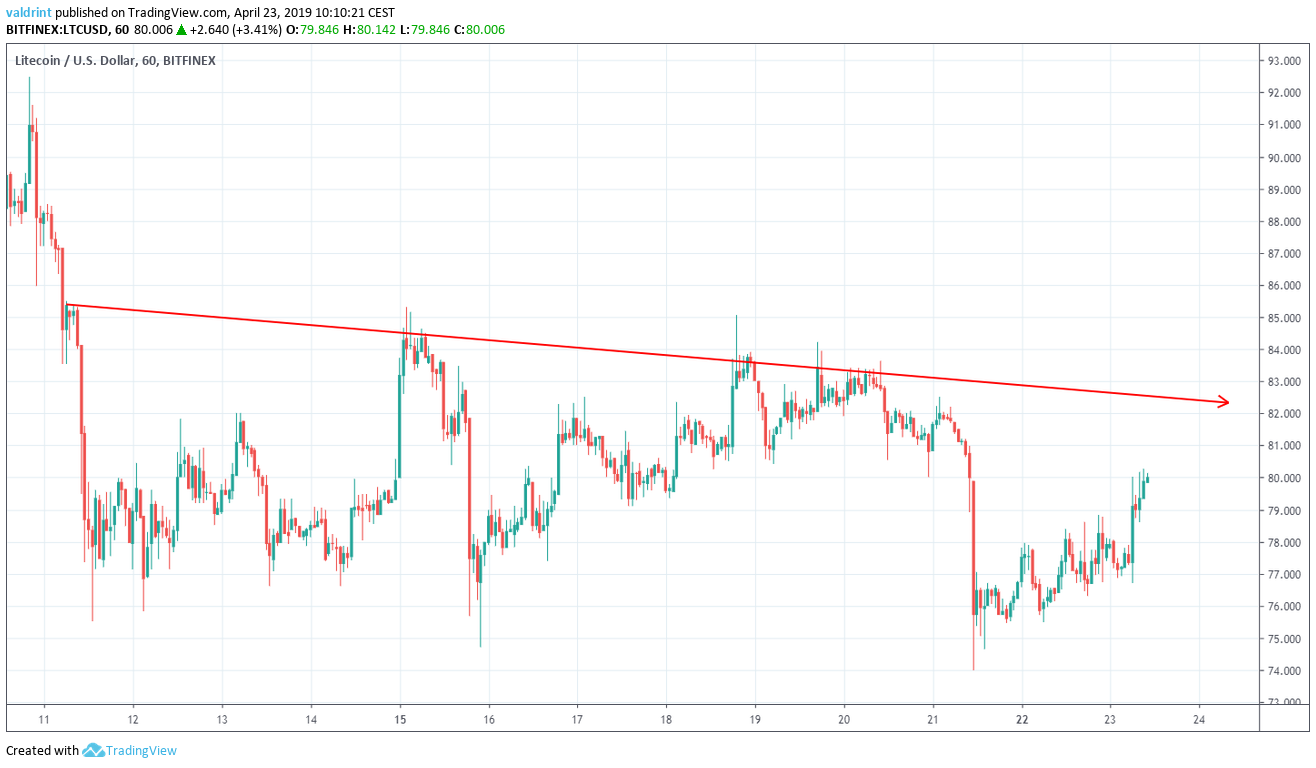
On Apr 15, the price reached a low of $74.72. A gradual increase was followed by a gradual decrease. The price has made several lower lows. Tracing these lows gives us a descending support line.
The support and resistance lines combine to create a descending channel:
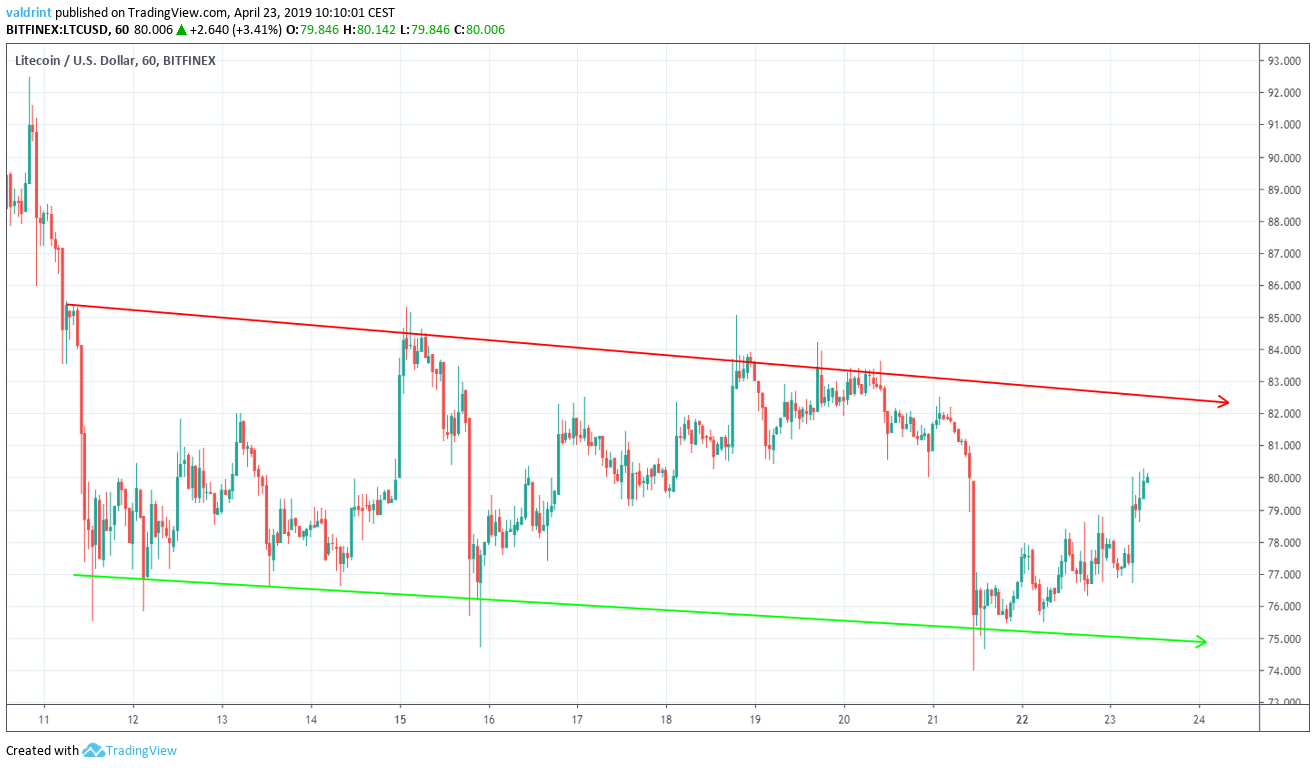
Litecoin is likely to trade inside the confines of the channel until a decisive move occurs.
In order to predict the direction of the move, we need to take a look at a longer time-frame combined with technical indicators.
Previous Breakdown
The price of LTC was analyzed from Feb to Apr alongside volume.
Volume is a measure of how much of a certain asset is traded in a certain period of time. Combined with the MACD, it can be used as a confirmation tool for the beginning of a trend.
In the graph below, volume is traced below the price and current trading pattern:
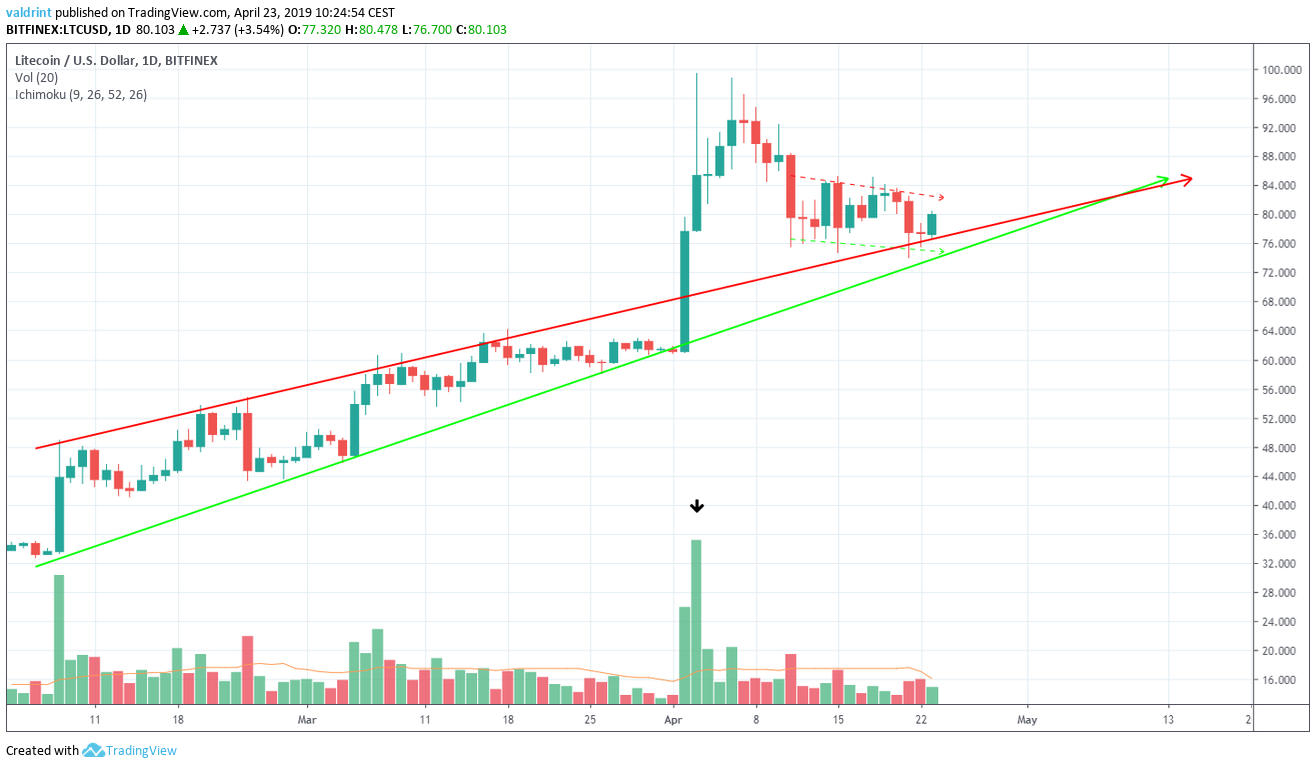
The price of LTC has been trading inside an ascending wedge since Feb 5. A breakout with significant volume occurred on Apr 3.
Afterward, the price dropped to validate the resistance line as support.
Using this indicator and previous price movement, we believe that the price will continue to increase at the rate predicted by the resistance line turned to support.
If the price keeps increasing, where will it find resistance?
Future Movement
To better determine actual future price levels, we examine resistance areas.
Resistance areas are formed when the price reaches a certain level several times. In the case of a breakout/breakdown, they can provide likely areas of reversal.
One resistance area is shown for LTC/USD in the first graph and LTC/EUR in the second graph:
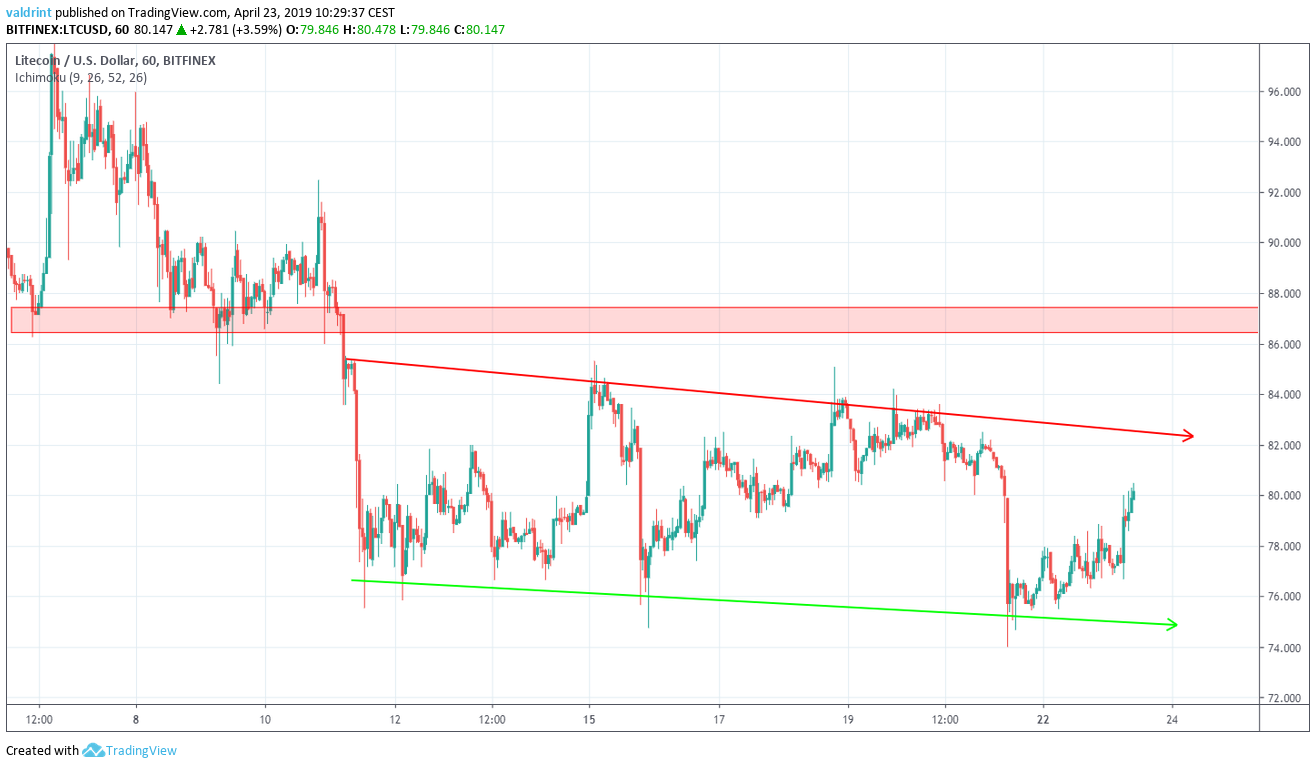
LTC/USD Resistance
LTC/EUR Resistance
The closest resistance area is found near $87 and €80. If the price breaks out of the channel, it is likely to reach this area. We believe this to be likely.
Summary Of Analysis
Based on this analysis, it is likely that the price will move towards the resistance line of the channel. An eventual breakout is likely.
Disclaimer: This article is not trading advice and should not be construed as such. Always consult a trained financial professional before investing in cryptocurrencies, as the market is particularly volatile.