
The Home Depot Inc. (NYSE:HD) reported better-than-expected top and bottom-line results for third-quarter fiscal 2016, gaining from balanced sales growth as well as persistent focus on productivity that bolstered earnings. With this, the company retained its four-year long trend of beating earnings estimates.
Consequently, shares of this home improvement retailer jumped 1.6% in the pre-market trading session.
The company posted fiscal third-quarter adjusted earnings of $1.60 per share, which jumped 18.5% from $1.35 in the year-ago quarter and beat the Zacks Consensus Estimate of $1.58.
HOME DEPOT Price, Consensus and EPS Surprise
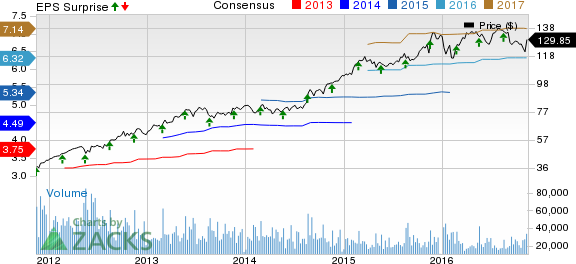
HOME DEPOT Price, Consensus and EPS Surprise | HOME DEPOT Quote
Quarterly Details
Net sales advanced 6.1% to $23,154 million from $21,819 million in the year-ago quarter. Further, the top-line marginally surpassed the Zacks Consensus Estimate of $23,036 million. The company's overall comparable-store sales (comps) increased 5.5%, while comps in the U.S. grew 5.9%. Sales growth can be attributable to a 2.4% increase in the number of customer transactions and a 3% rise in average ticket.
Gross profit in the reported quarter improved 6.3% to $8,042 million from $7,565 million in the year-ago quarter, primarily driven by higher sales. However, gross profit margin remained flat at 34.7%.
Improved gross profit led operating income to increase 11.4% to $3,320 million during the fiscal quarter. Further, operating margin expanded 60 bps from the year-ago quarter to 14.3%.
Balance Sheet and Cash Flow
Home Depot ended fiscal third-quarter with cash and cash equivalents of $3,589 million, long-term debt (excluding current maturities) of $22,338 million and shareholders' equity of $5,622 million. In the first three quarters of fiscal 2016, the company had generated $7,919 million of net cash from operations.
Fiscal 2016 Outlook
Following the robust fiscal third-quarter, Home Depot reiterated its sales and comps guidance, while it raised its earnings forecasts for fiscal 2016. The company continues to project sales growth of 6.3%, with about 4.9% improvement in comps.
Home Depot now envisions diluted earnings per share to grow about 15.9% year over year compared with $6.33 earned in fiscal 2015. Previously, the company had forecast earnings per share growth of 15.6% year over year.
Zacks Rank
Currently, Home Depot carries a Zacks Rank #4 (Sell). Better-ranked stocks in the retail space are Tile Shop Holdings, Inc. (NASDAQ:TTS) , Foot Locker Inc. (NYSE:FL) and Zumiez Inc. (NASDAQ:ZUMZ) , each carrying a Zacks Rank #2 (Buy). You can see the complete list of today’s Zacks #1 Rank (Strong Buy) stocks here.
Tile Shop has gained nearly 15.2% year to date. Moreover, it has a long-term earnings growth rate of 25%.
Foot Locker, with a long-term earnings growth rate of 9.9%, is up nearly 9.8% year to date.
Zumiez has jumped 64.4% year to date. The stock has a long-term earnings growth rate of 15%.
Zacks’ Best Private Investment Ideas
In addition to the recommendations that are available to the public on our website, how would you like to follow all Zacks' private buys and sells in real time?
Our experts cover all kinds of trades… from value to momentum . . . from stocks under $10 to ETF and option moves . . . from stocks that corporate insiders are buying up to companies that are about to report positive earnings surprises. You can even look inside exclusive portfolios that are normally closed to new investors. Starting today, for the next month, you can have unrestricted access. Click here for Zacks' private trades >>
HOME DEPOT (HD): Free Stock Analysis Report
ZUMIEZ INC (ZUMZ): Free Stock Analysis Report
FOOT LOCKER INC (FL): Free Stock Analysis Report
TILE SHOP HLDGS (TTS): Free Stock Analysis Report
Original post
Zacks Investment Research