This article was written exclusively for Investing.com
- Silver is more volatile than gold
- Finally broke through technical resistance
- Levels to watch on the upside as price action could remain wild
- Silver may be heading for a new record high
It's been a wild ride for silver in 2020. During 2019, the precious metal traded in a $5.295 range on the nearby COMEX futures contract. The previous year, the trading band was $3.845. In 2017, silver’s range was even narrower at $3.505. However, in 2016, when the price briefly probed above $21, the high to low differential was $7.365.
On the other hand, over the first eight months of this year, silver fell to a low of $11.74, the lowest level in eleven years, then reached a high of $29.915, a seven-year peak. The $18.175 trading range over six months was the widest annual trading range for the white metal since 2011 when silver traded to its highest price since 1980 at $49.82 per ounce.
Gold broke above its critical technical level to the upside in June 2019 when the price rose above the July 2016 high of $1377.50 per ounce. It took silver another thirteen months to conquer its 2016 peak.
The technical break to the upside in the silver market was a significant event. At just under $27 per ounce at the end of last week, the price was closer to the high than the low for 2020, and silver’s technical position continues to look bullish.
Silver is a metal that tends to attract lots of speculative and trend-following interest. As of August 2020, the silver market is in play, and the potential for additional gains is at the highest level in years.
Silver more volatile than gold; it's been a wild ride since March
While gold is an investment asset, silver tends to attract far more speculative interest. When the price begins to trend, interest in the silver market increases. Over the long-term, price variance in the silver futures market runs at a much higher level than gold.
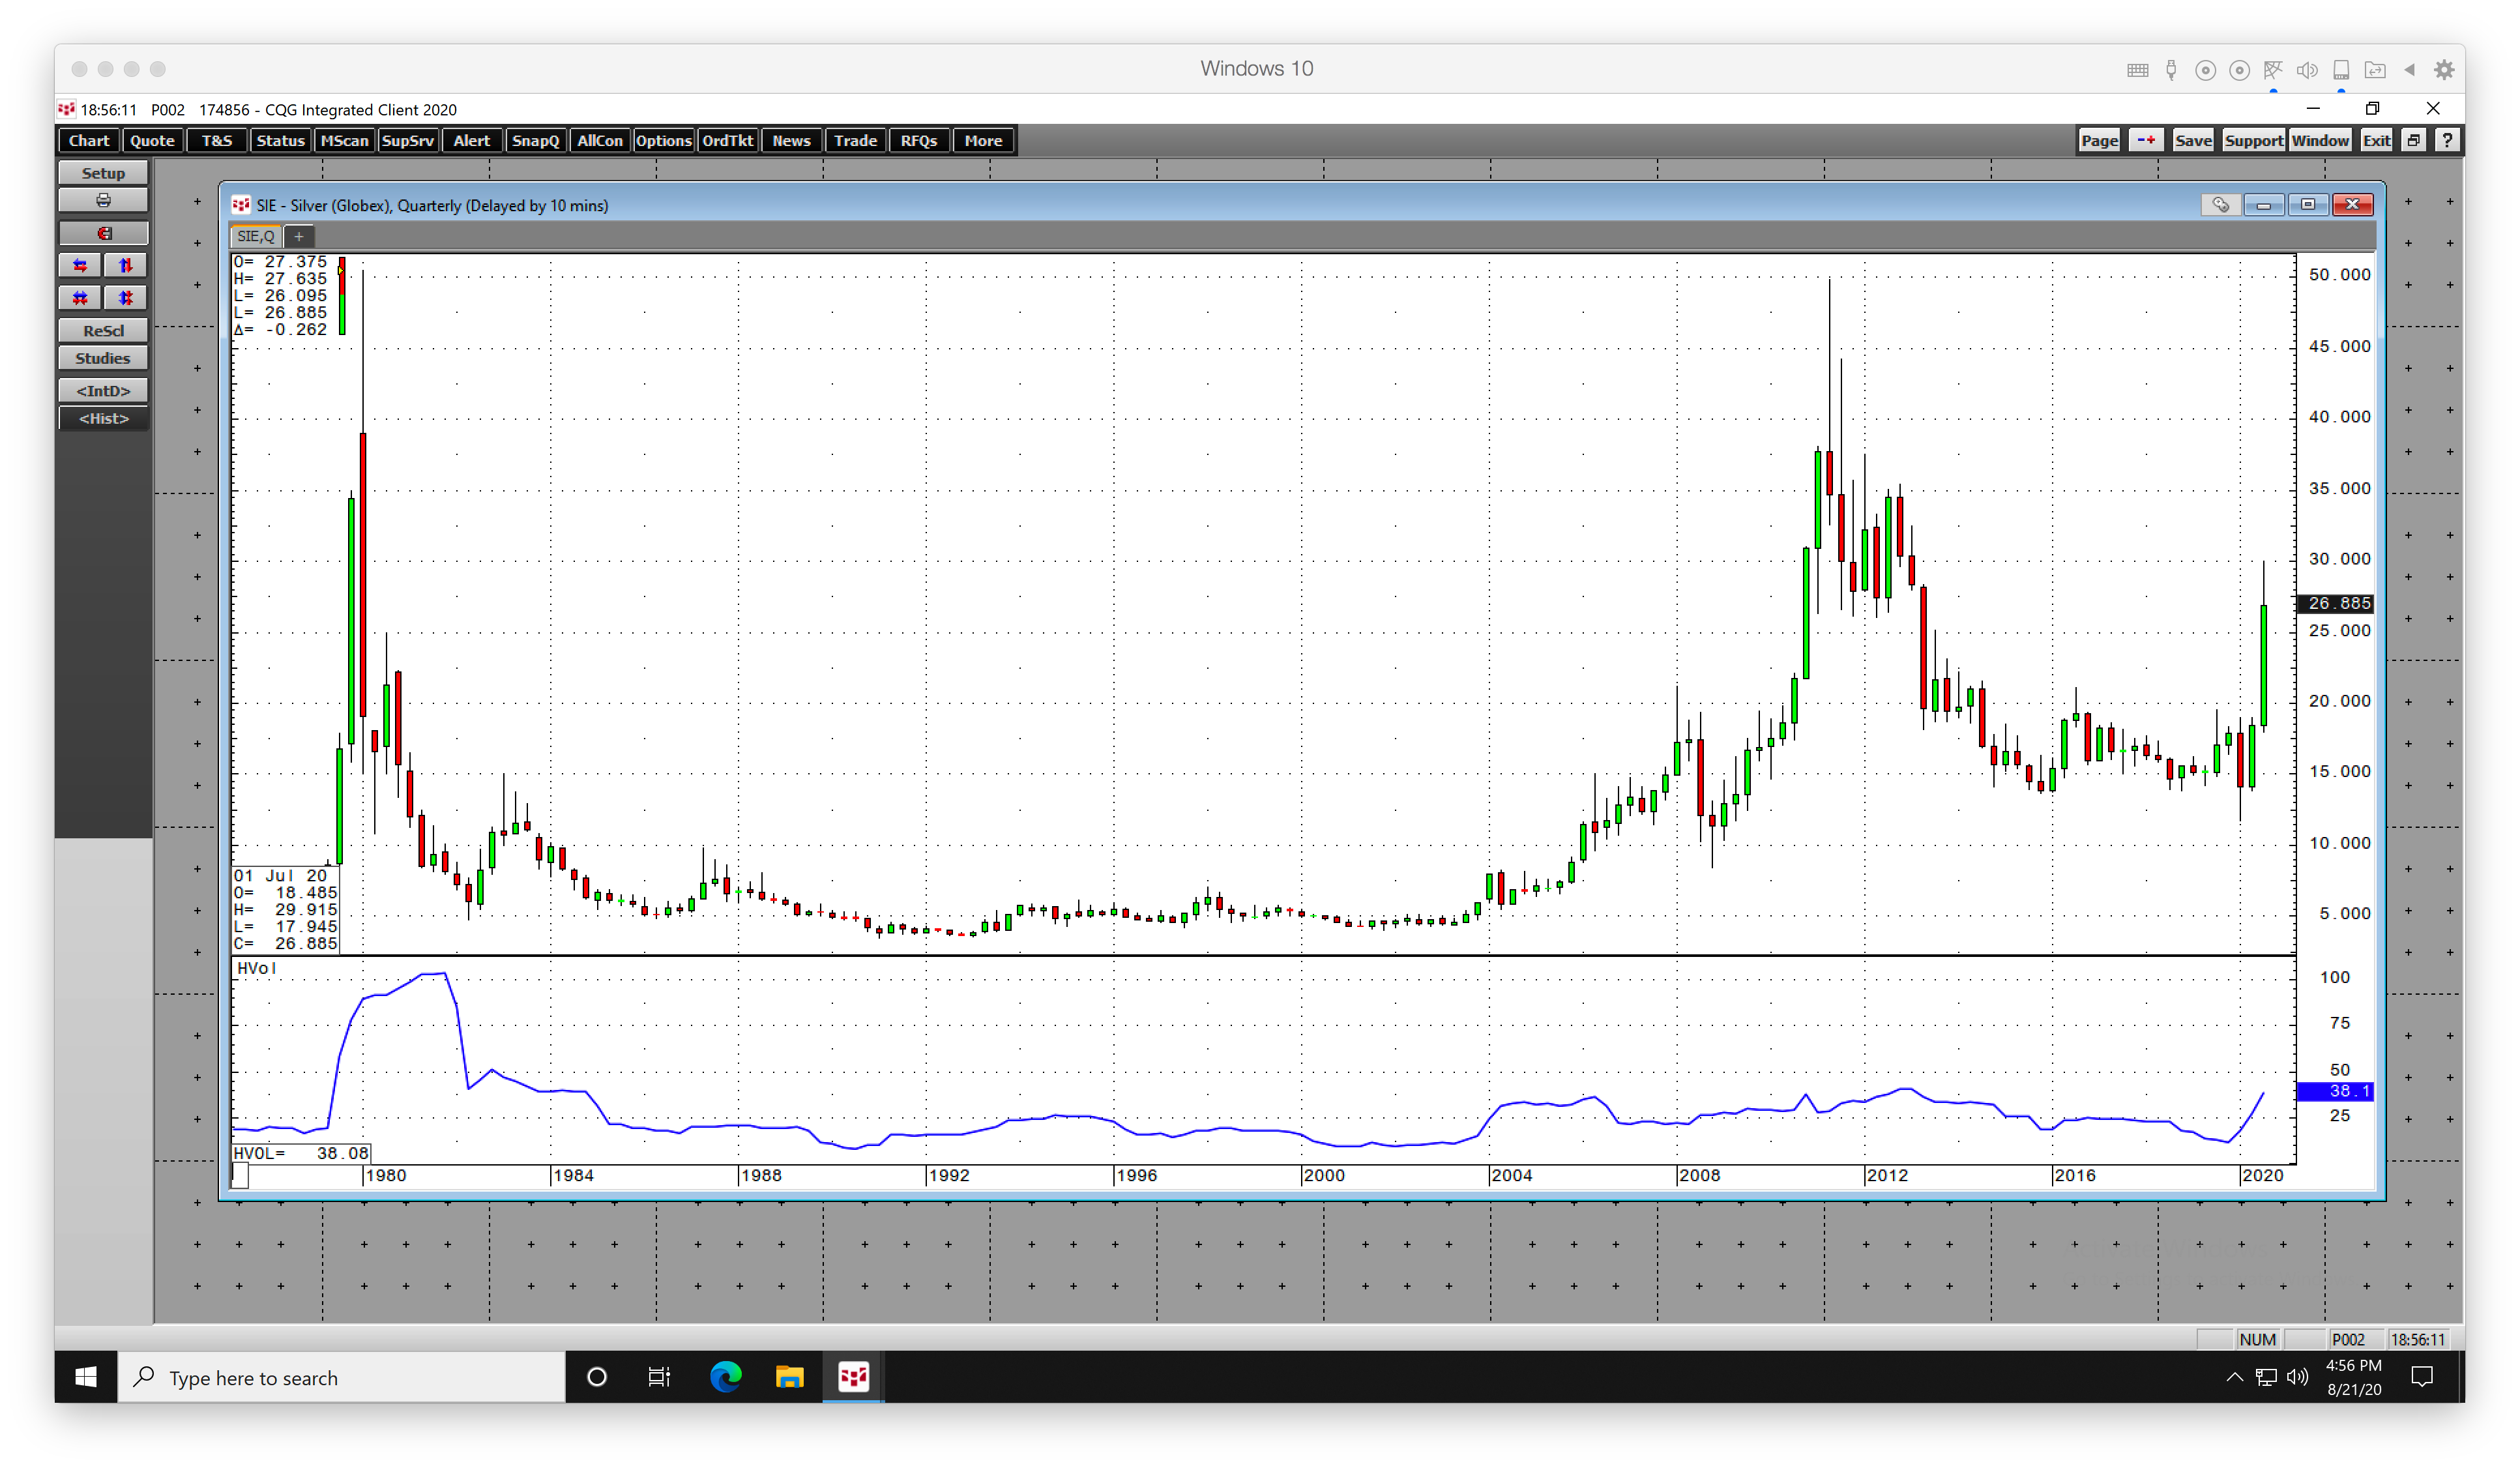
Source, all charts: CQG
At the end of last week, quarterly historical volatility in the silver market stood at 38.1%.
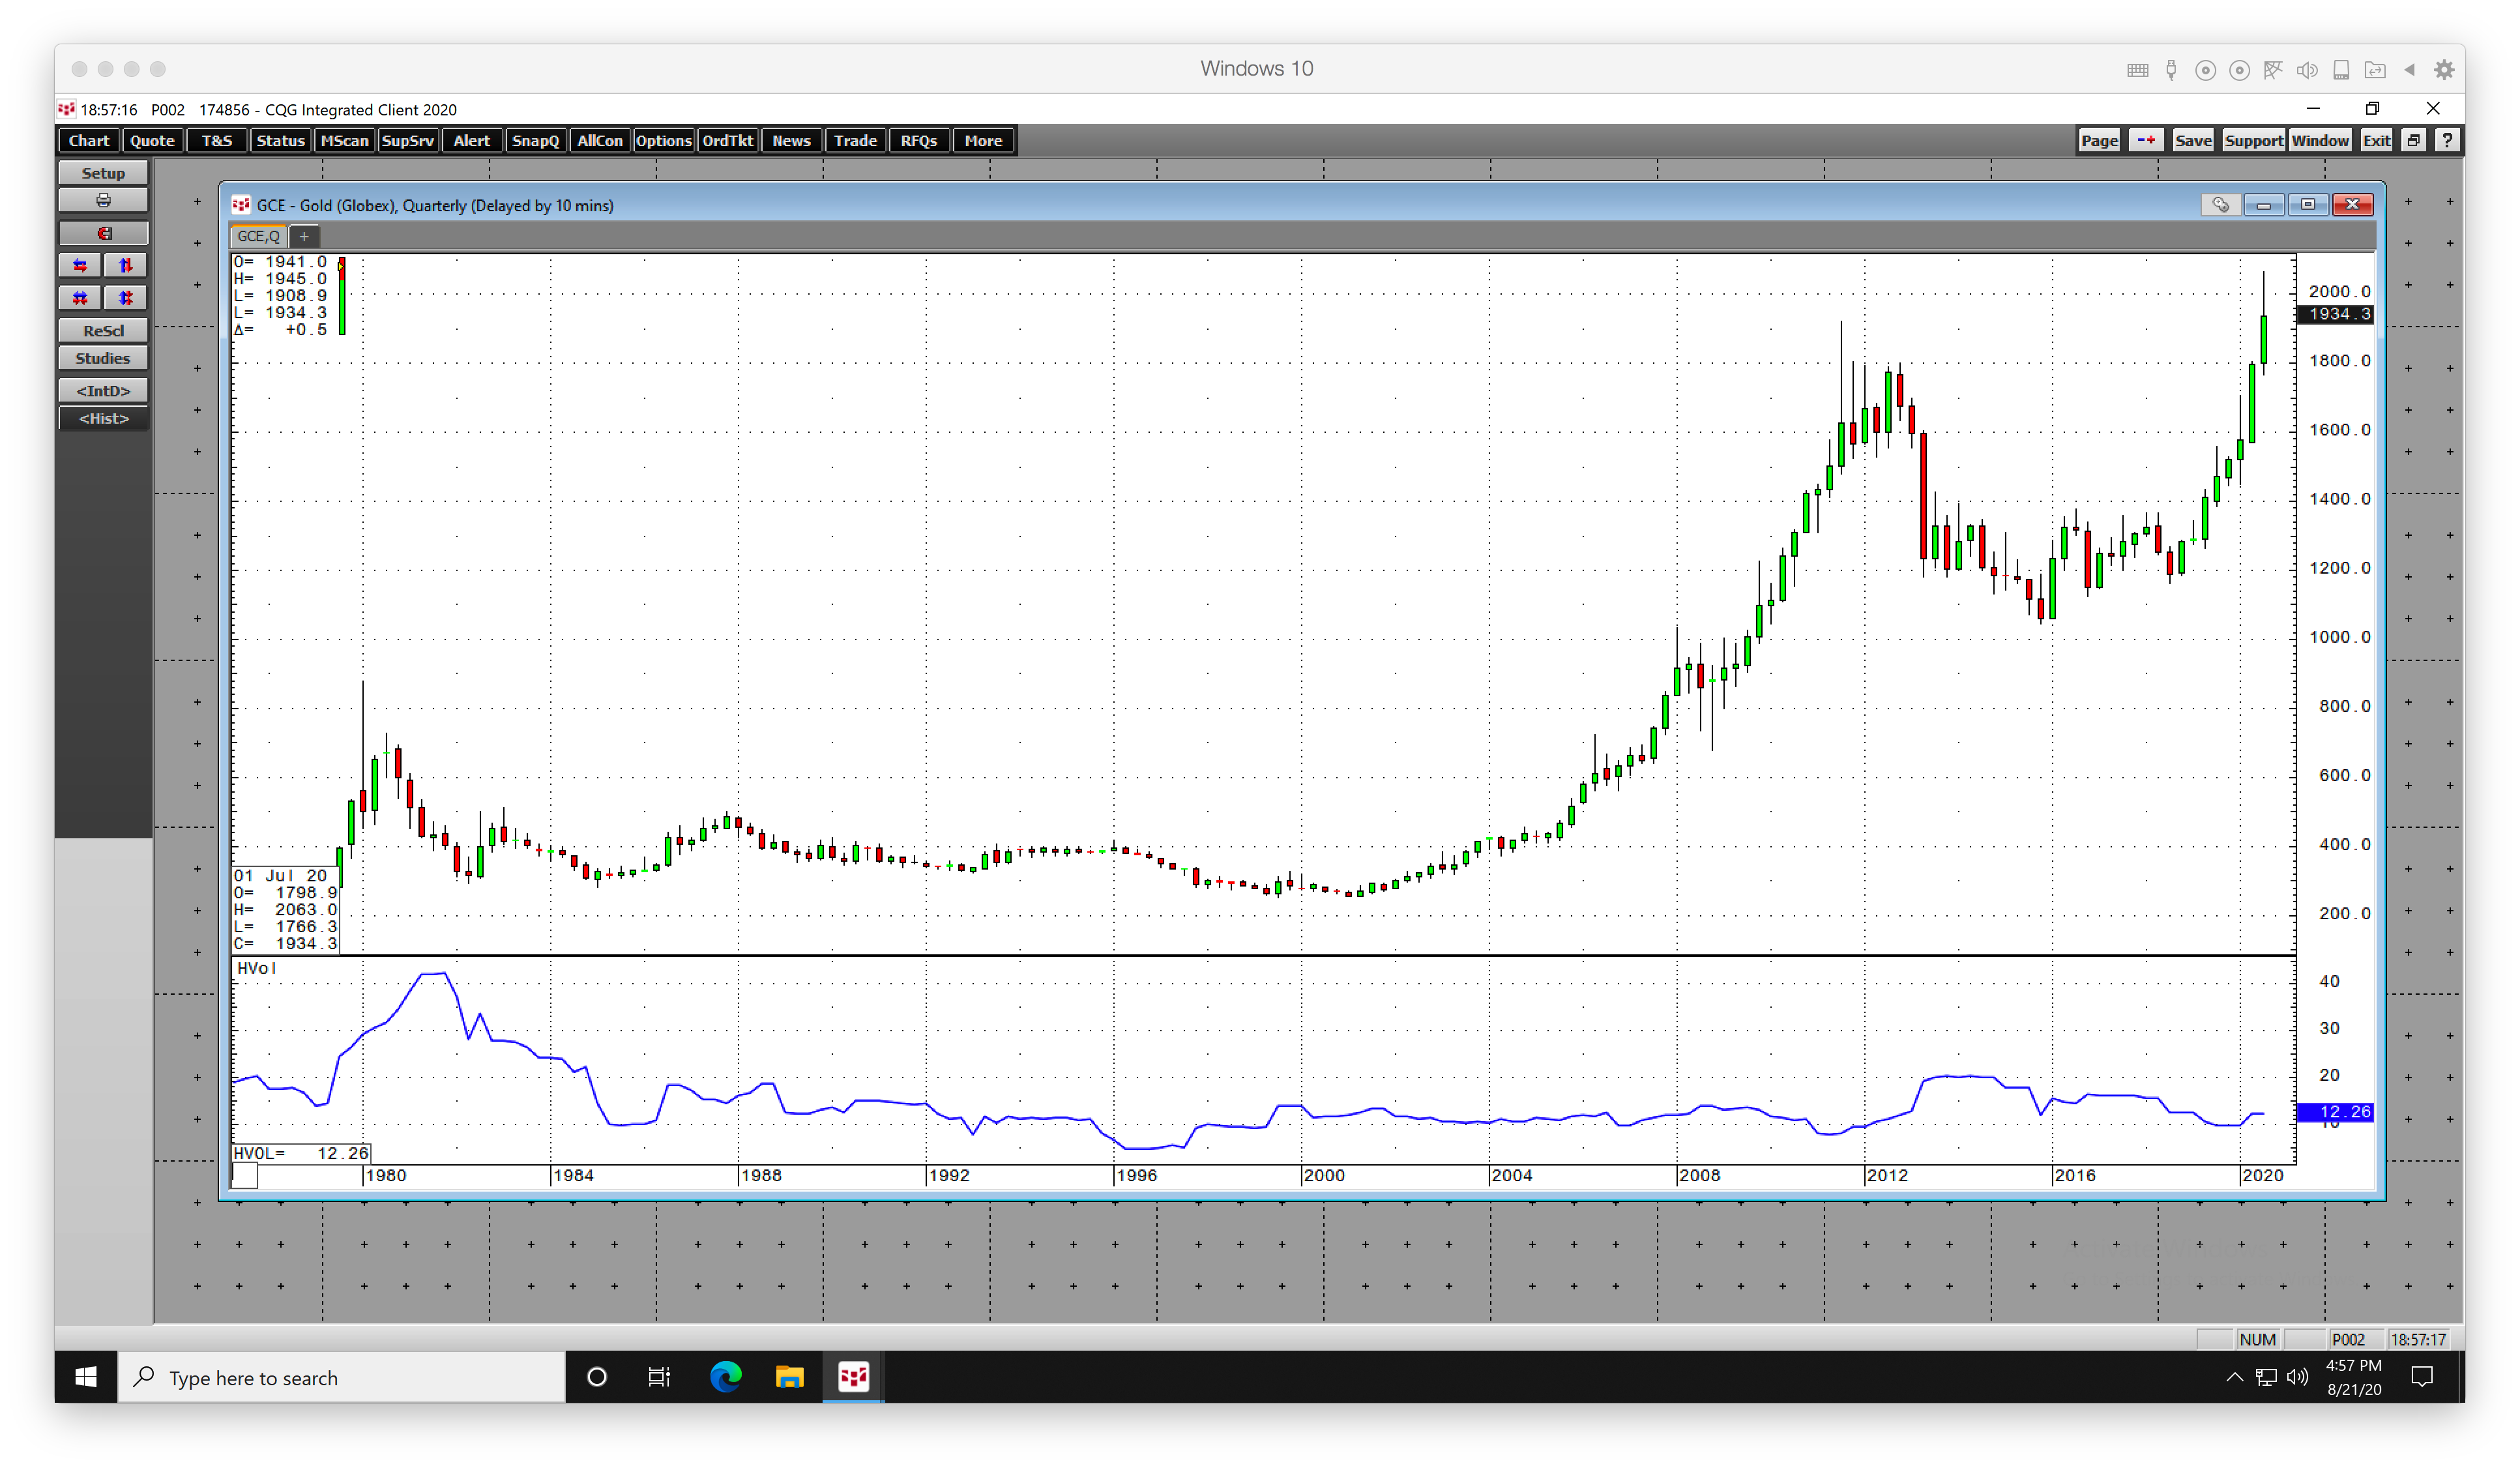
The quarterly chart shows that the metric was under one-third the level in gold at 12.26%.
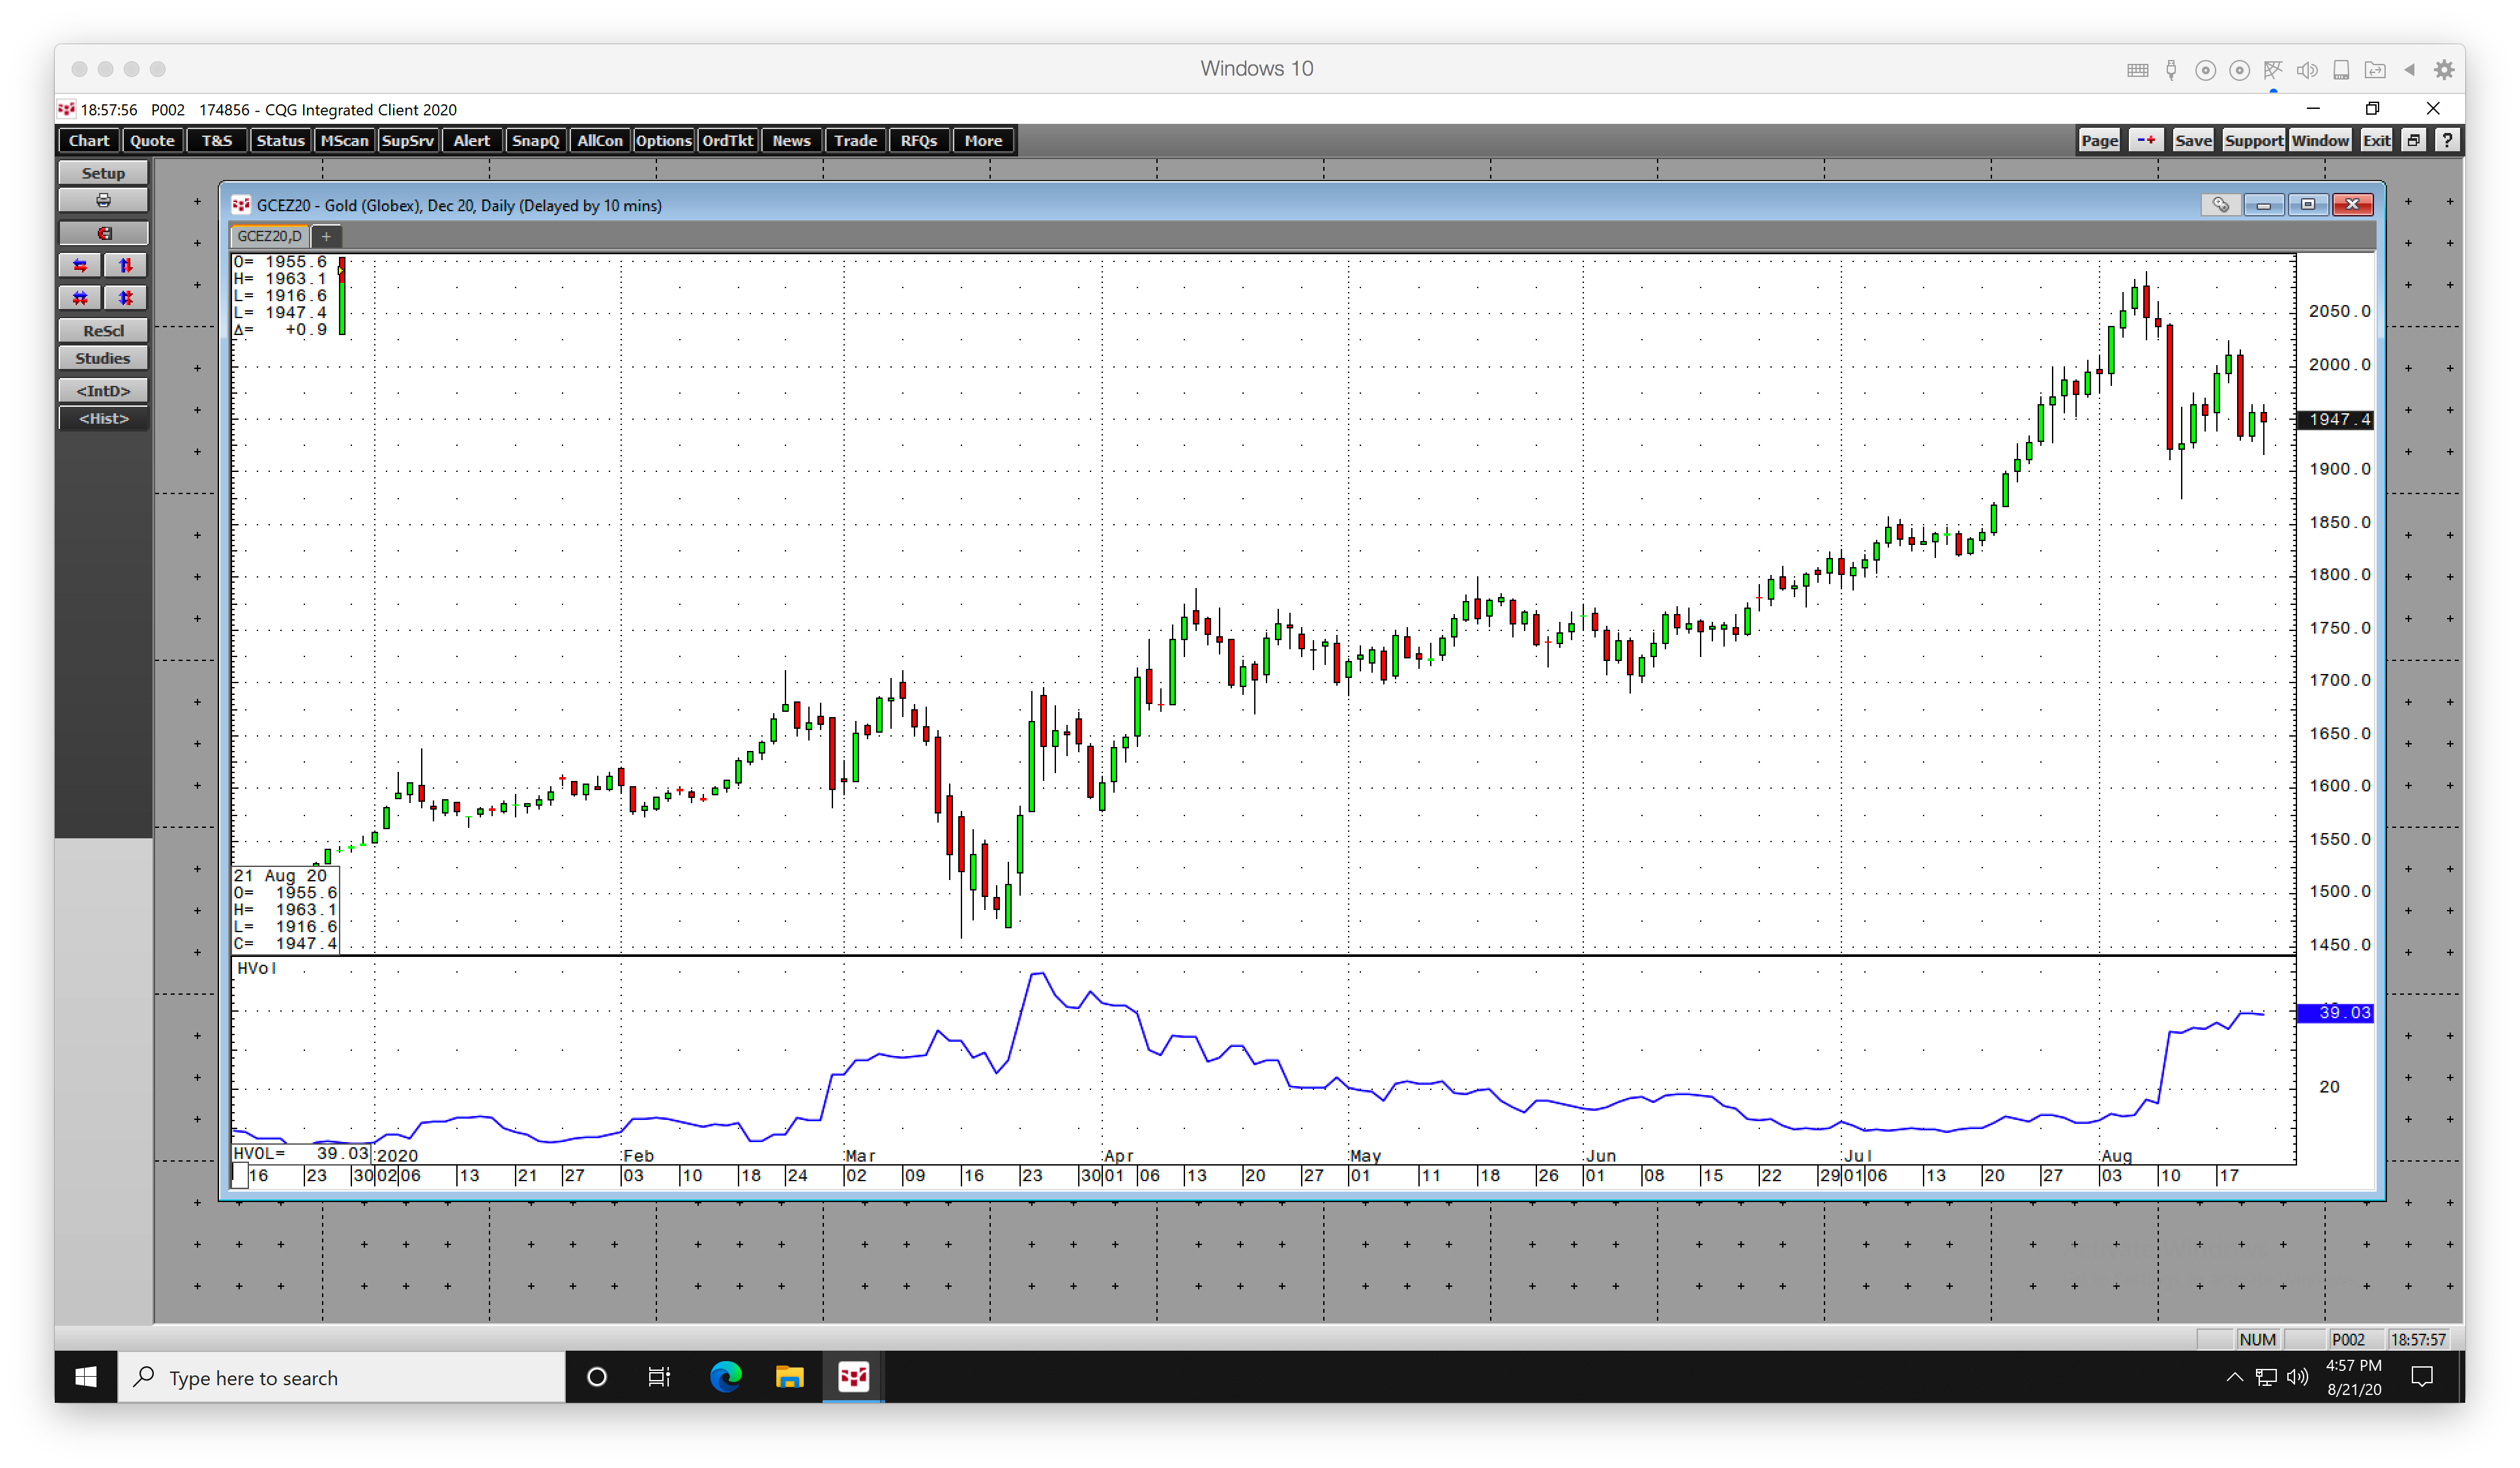
At the end of last week, daily historical volatility in gold was at the 39.03% level.
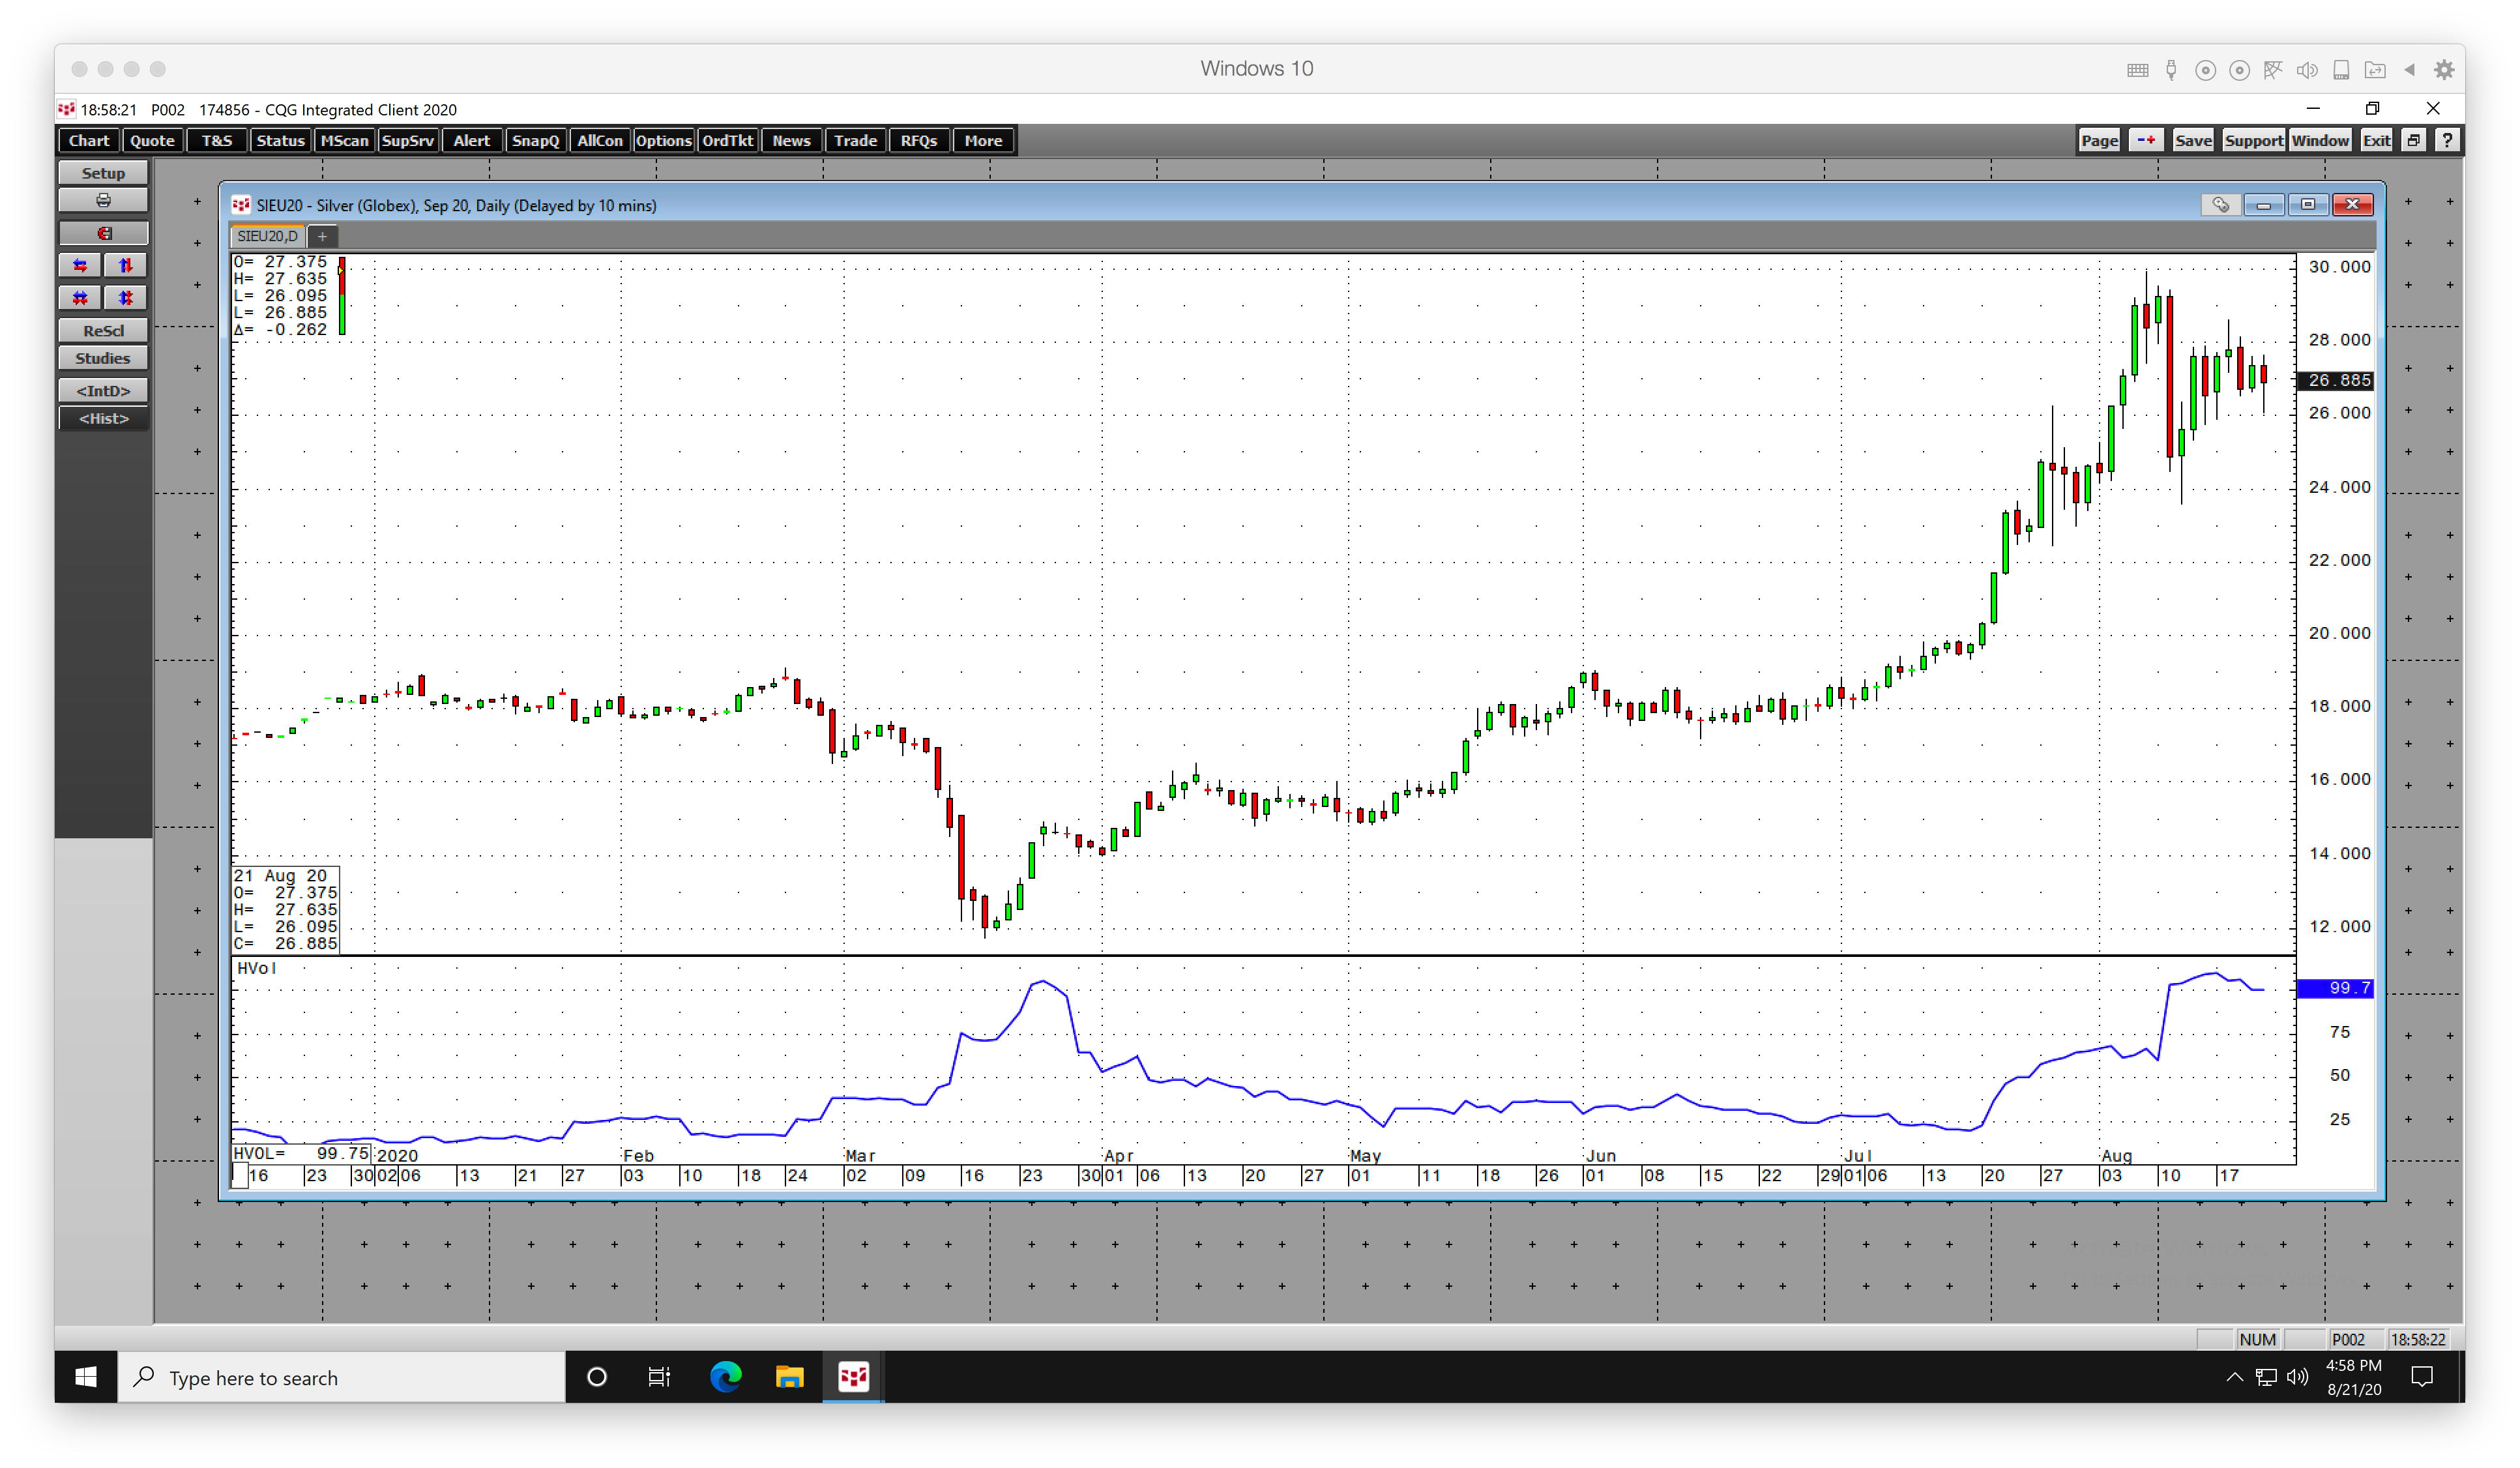
In the silver market, it was at 99.7%. The trading ranges in silver tend to be far higher than in gold. The yellow metal has traded in a $612.10 or 42.2%% range so far in 2020. Silver’s price band has been $18.175 or 155%.
Silver finally broke through technical resistance
Gold broke above its critical level of technical resistance at the July 2016 peak of $1377.50 in June 2019. Over the next fourteen months, the price rose to a high of $2063 on the continuous contract or 49.8% this August.
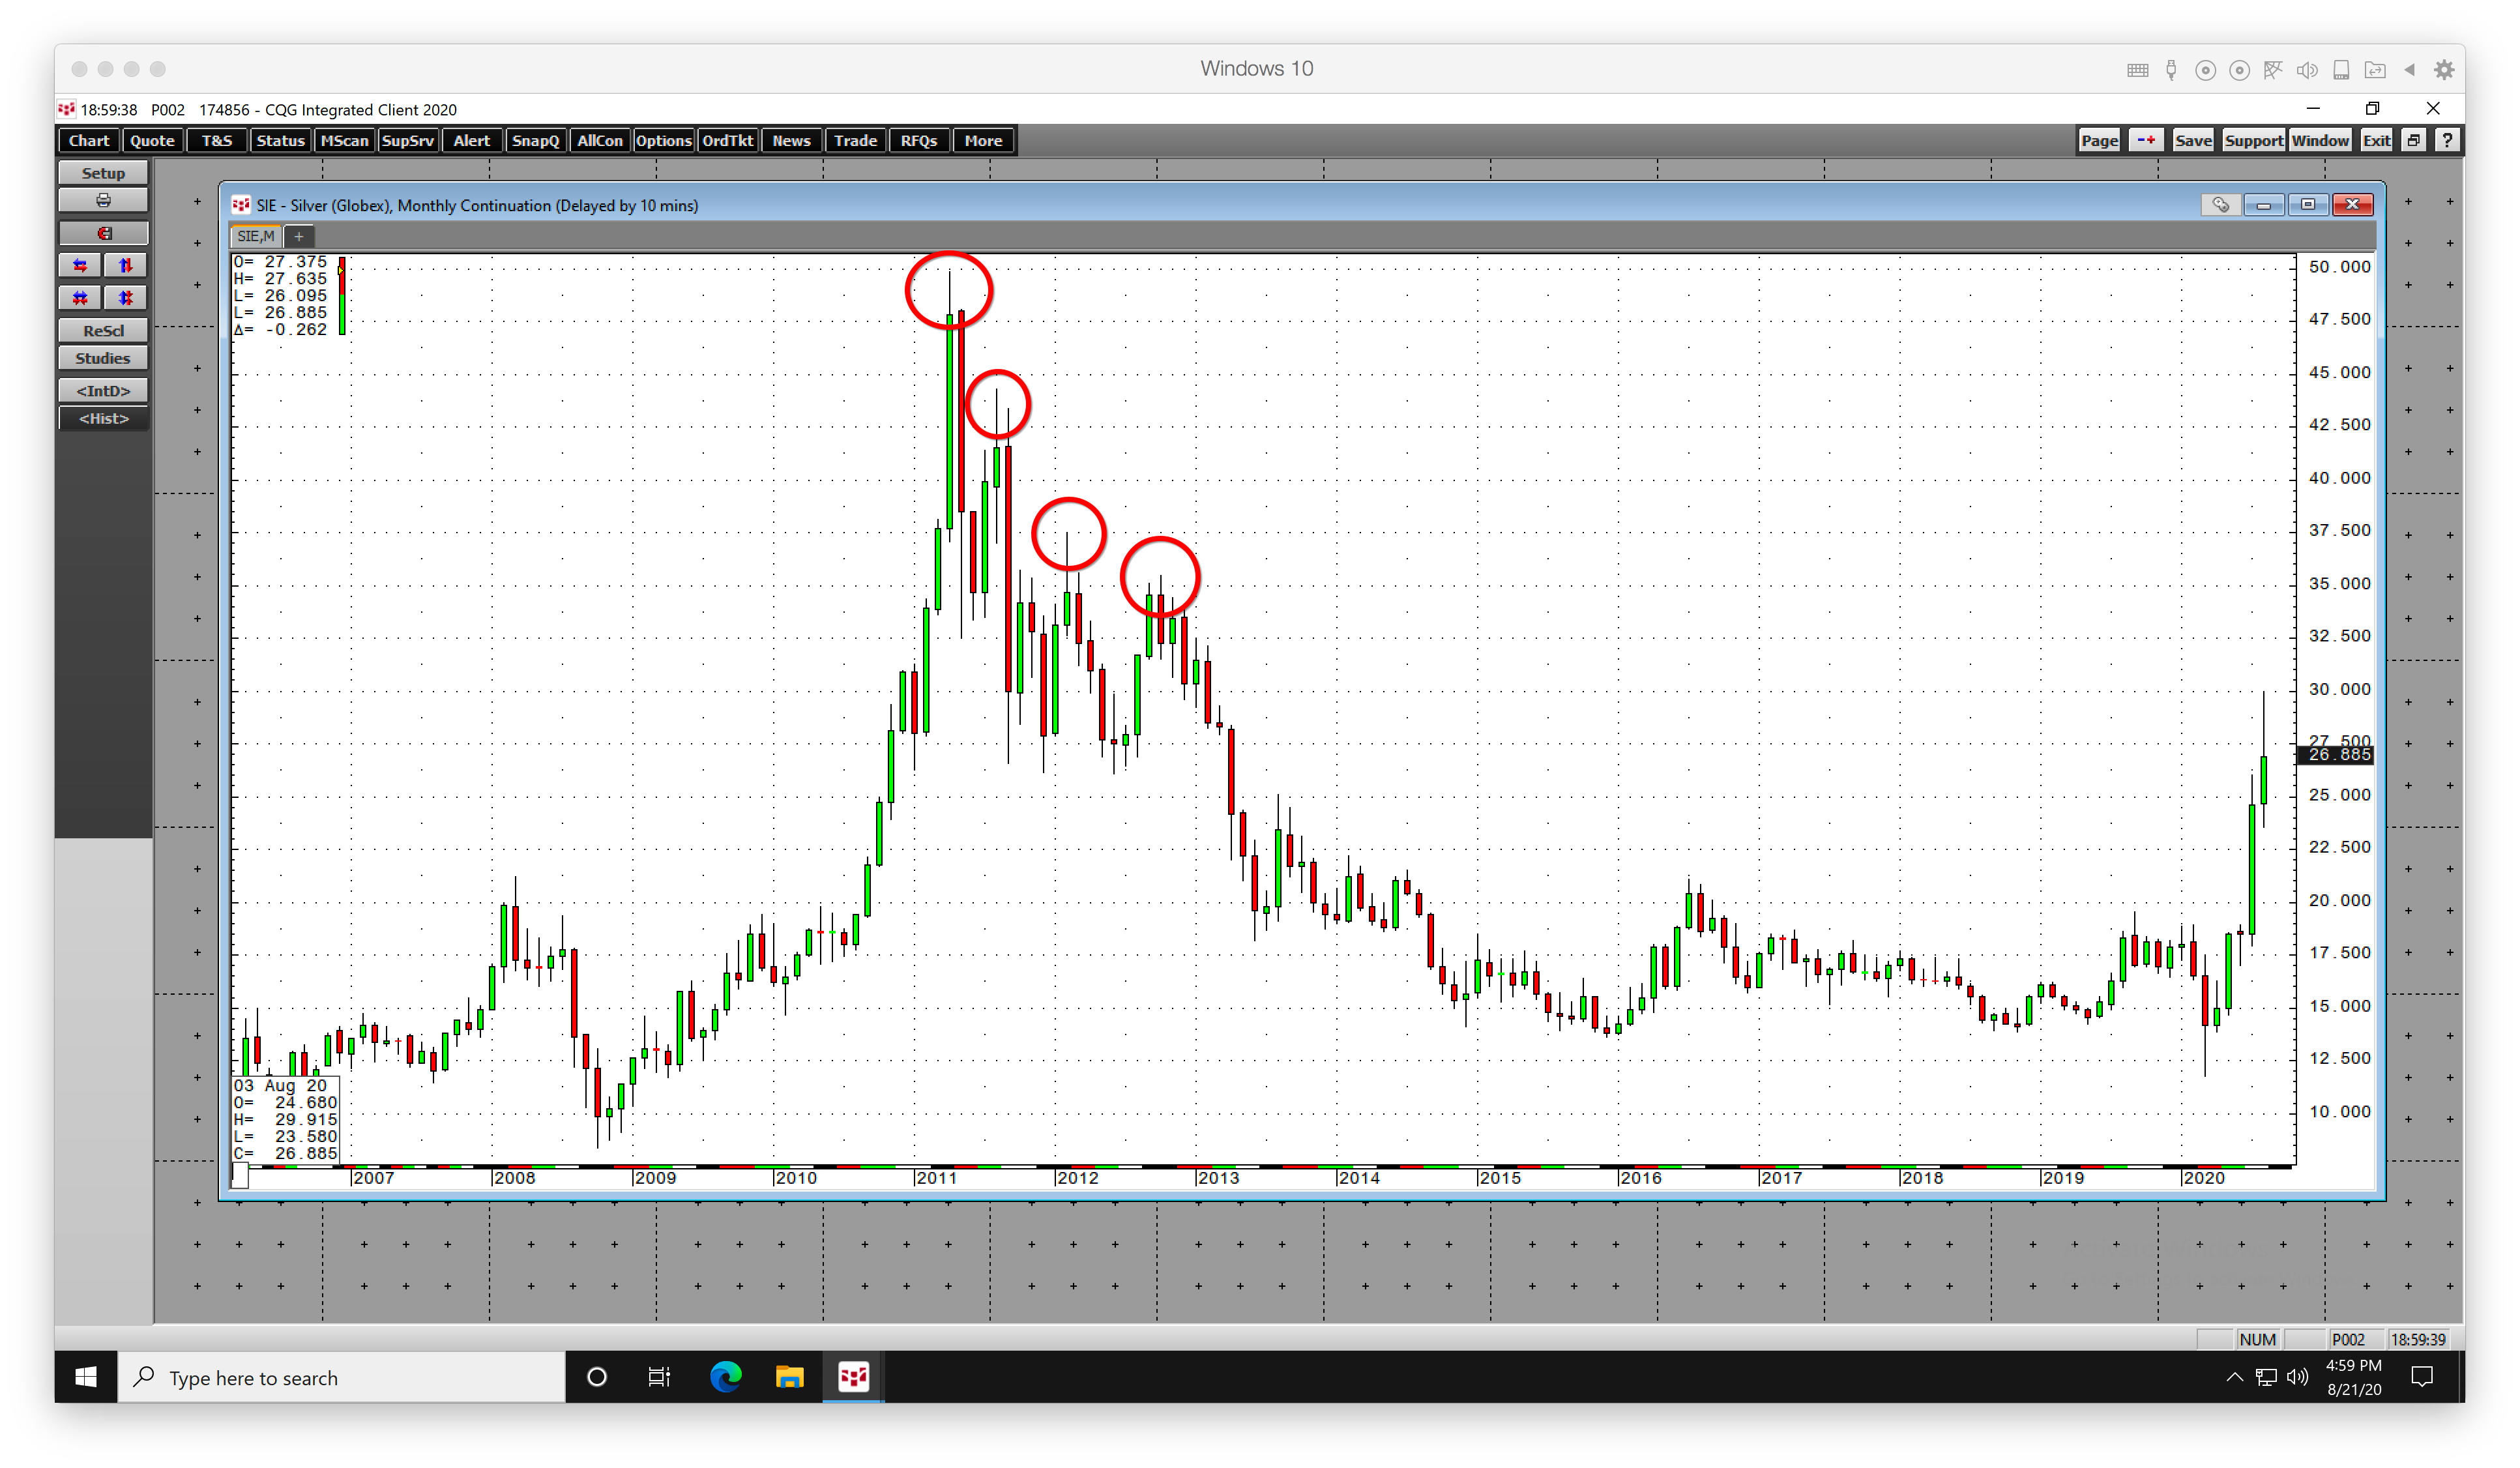
The monthly chart shows that it took silver until July 2020 to break above its technical resistance level at the 2016 peak at $21.095. However, silver rose to $29.915 over the past month or 41.8% above the breakout level.
Before silver broke higher in July, the price had dropped to a low of $11.74 in March. In only five months, silver made an eleven-year low and a seven-year high.
Levels to watch on the upside: price action might remain wild
Technical support for silver now stands at the breakout level at $21.095 per ounce on the nearby COMEX futures contract. On the upside, above the recent peak at just below $30 per ounce, the first level to watch is the October 2012 high at $35.445 per ounce. The next level is at $37.48, the February 2012 high, and $44.275, the August 2011 apex in the silver market.
The March 2011 high at $49.82 is another target, but the 1980 all-time peak at $50.36 could be the ultimate goal for the precious metal.
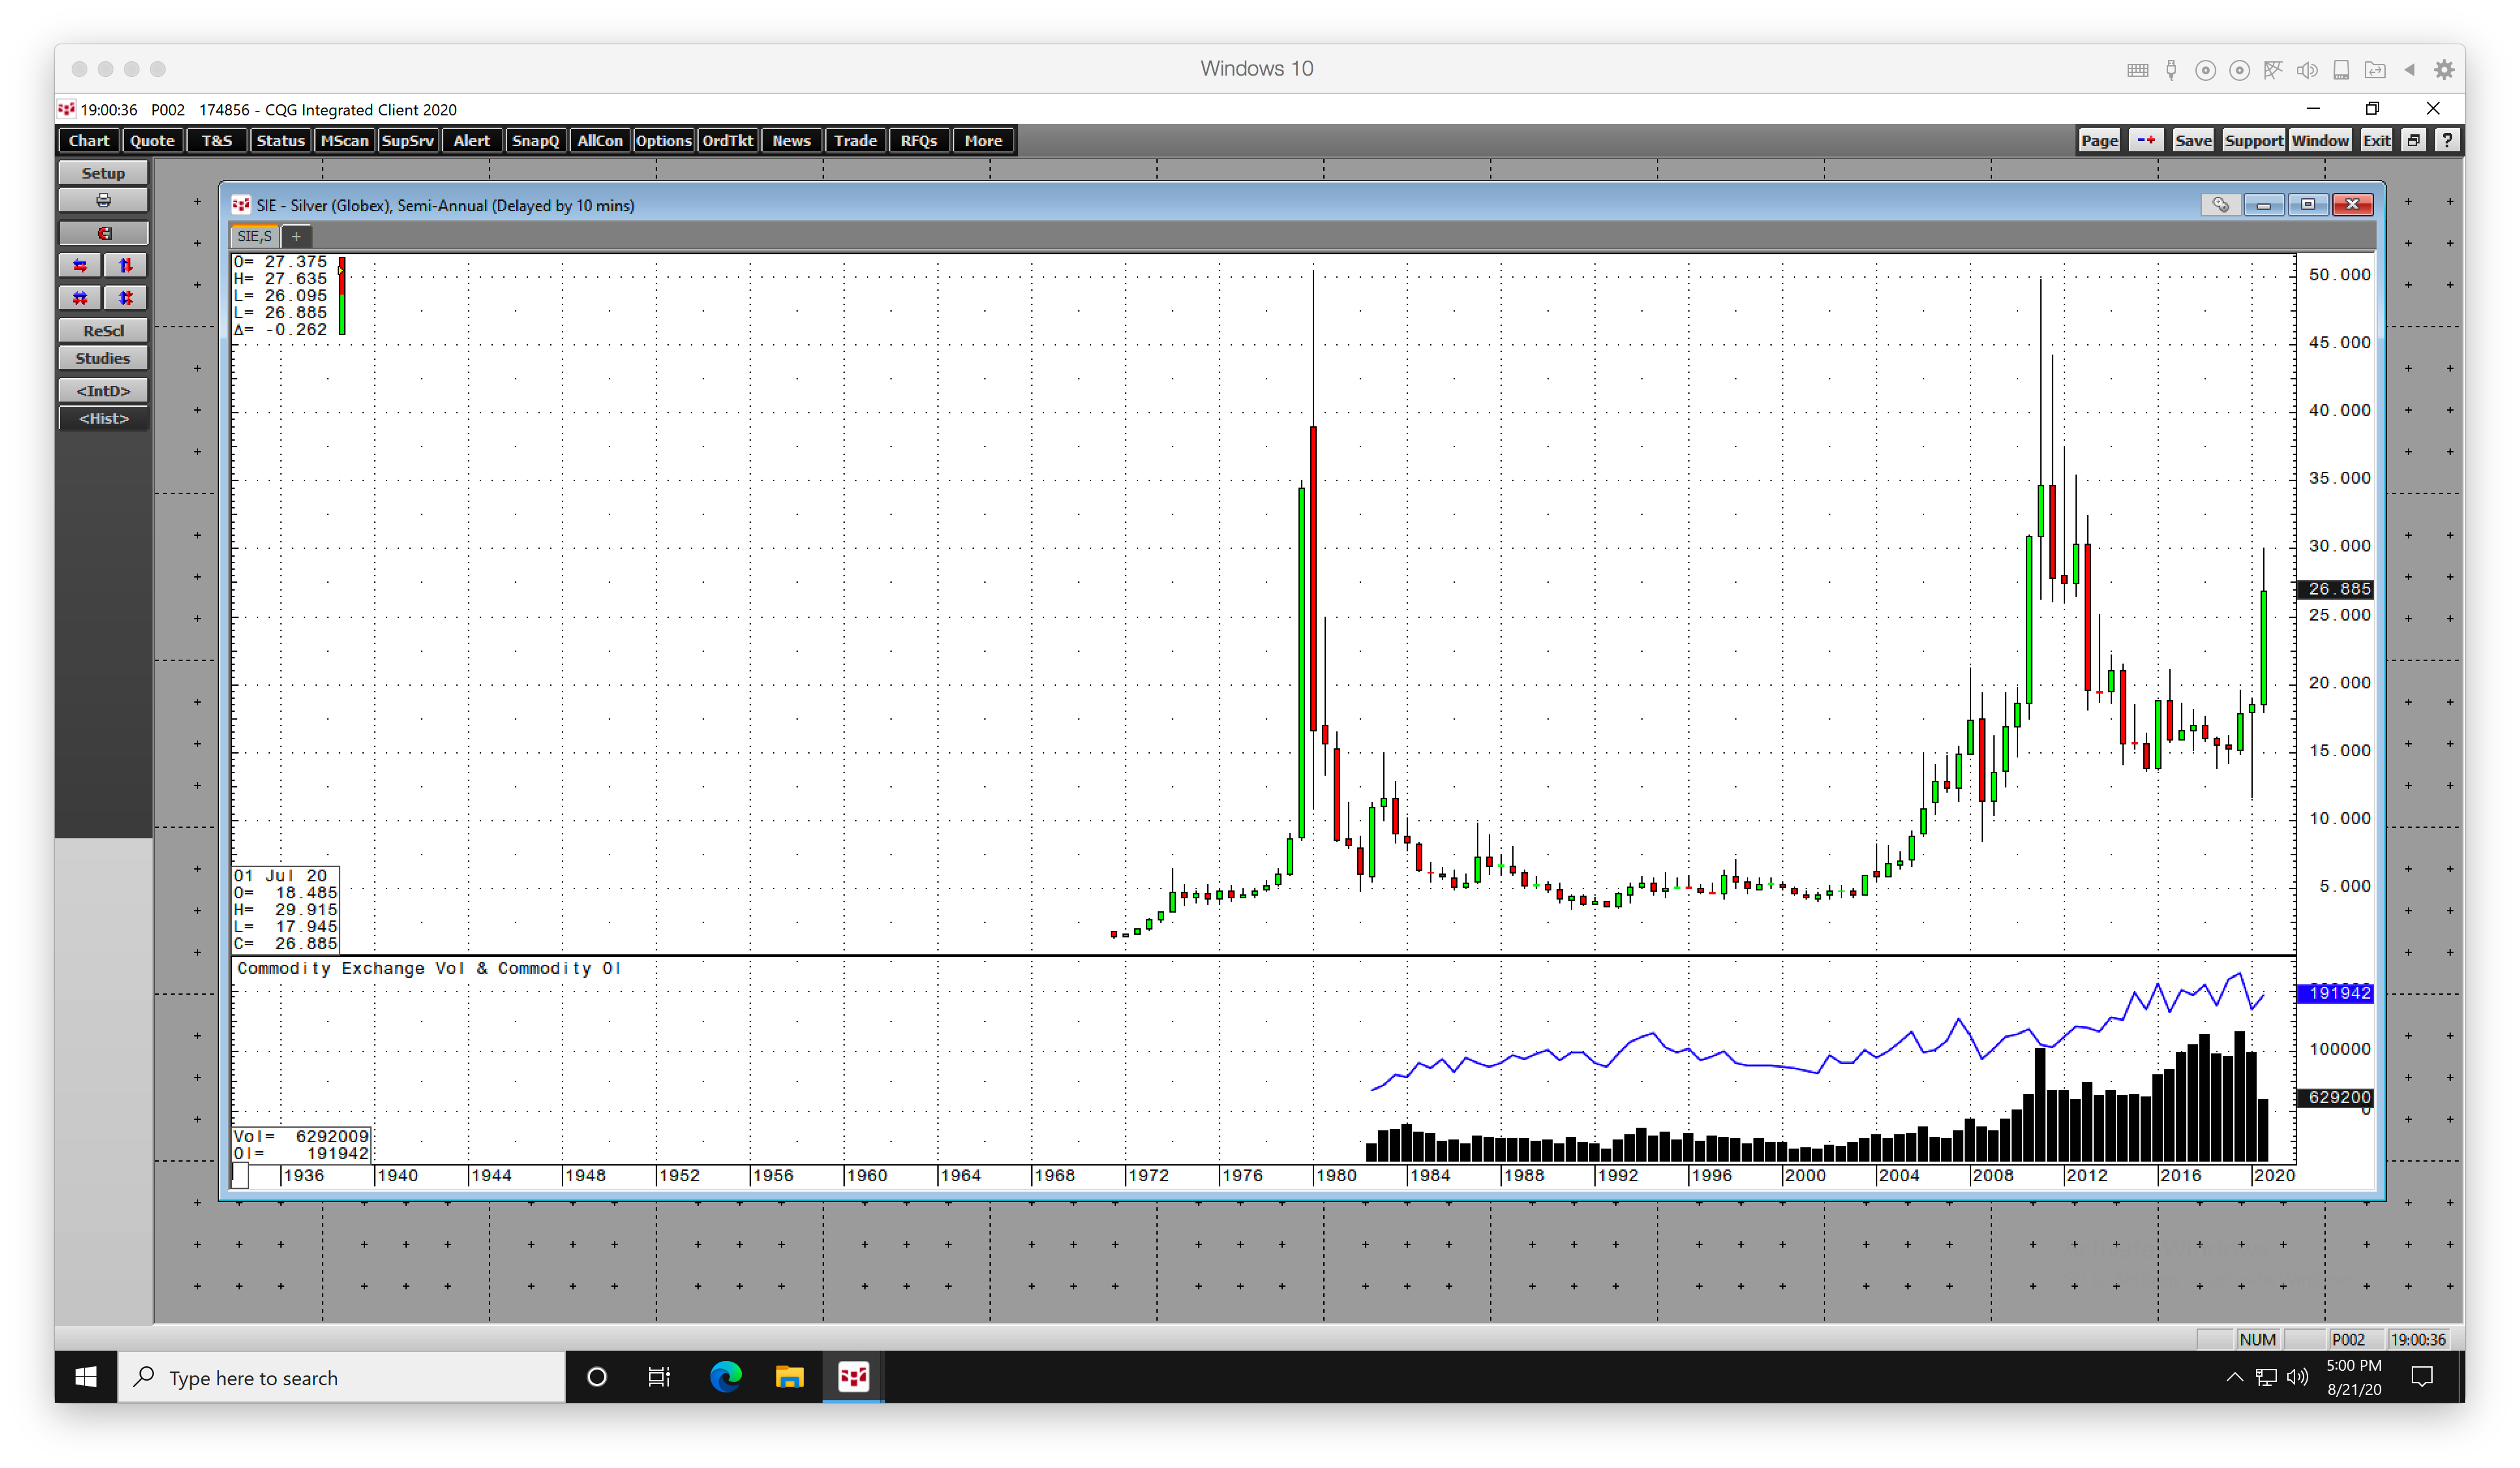
The semi-annual chart of COMEX silver futures, highlights that the total number of open long and short silver positions has been steadily rising over the past four decades. Rising open interest reflects the increase in speculative positions in the silver market.
Moreover, the advent of ETF and ETN products that allow investors and speculators to hold silver without venturing into the physical or futures market has expanded the metal’s addressable market. During rallies, market participants tend to flock to the silver market.
Silver could be heading for a new record high
The current environment favors the upside in silver, even after the explosive rally from March through August.
Global interest rates are at all-time lows with European and Japanese short-term yields in negative territory. After rising from zero percent to the 2.5% level from 2016 through 2018, the short-term US Fed Funds rate is back at zero percent.
The US central bank has cautioned market participants to expect rates to stay at the current level until at least 2022. At the same time, quantitative easing continues to push rates to historical lows further out along the yield curve.
Low interest rates lower the cost of carrying long positions in silver and all hard assets. At the same time, they have pushed the value of the US dollar and all fiat currencies down, as governments provide unprecedented levels of stimulus as they battle the global pandemic.
The US dollar is the pricing mechanism for silver and most commodities. A weakening dollar tends to support higher raw material prices.
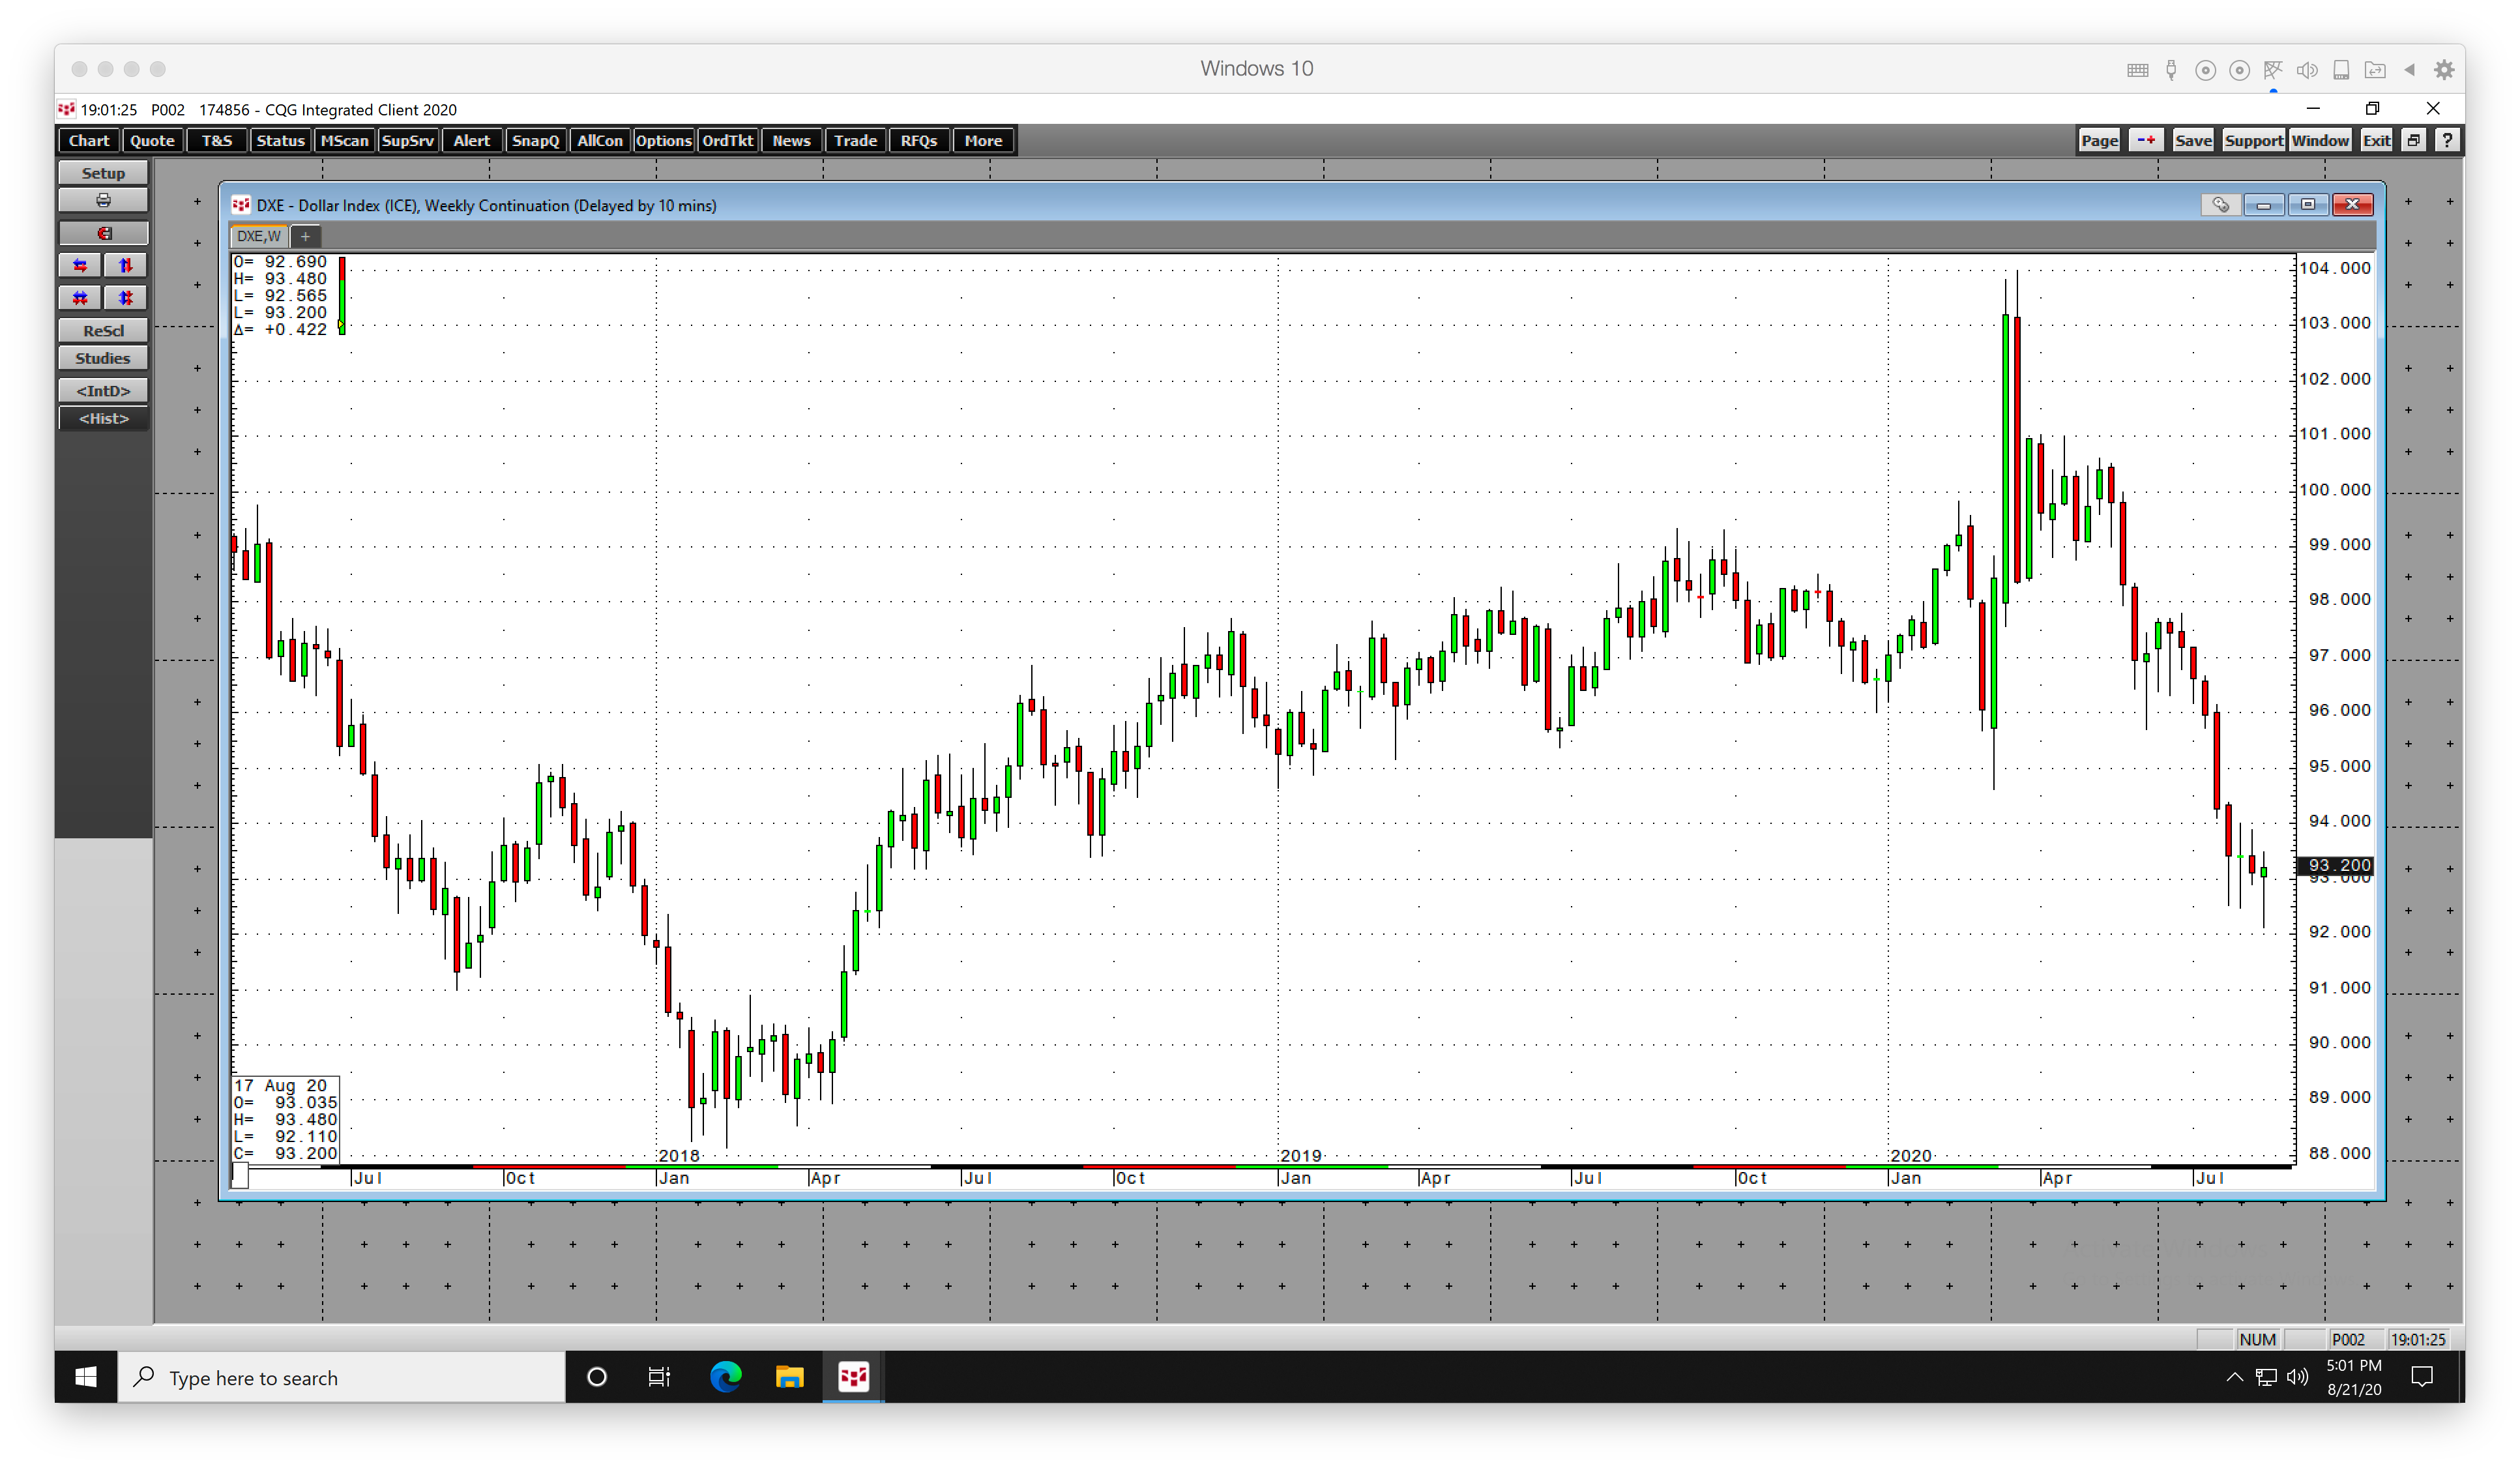
The weekly chart of the US Dollar Index shows that it dropped from an eighteen year high at 103.96 in March to an over two-year low at 92.11 last week. The 11.4% drop in the dollar is another supportive factor for silver.
I expect silver to continue to trade in a wide range.
However, any significant price corrections are likely to be buying opportunities as silver heads for a challenge of the 2011 peak and the all-time high from 1980. I'm anticipating we'll see silver significantly above the $50 per ounce level over the coming months and years in the current environment.
