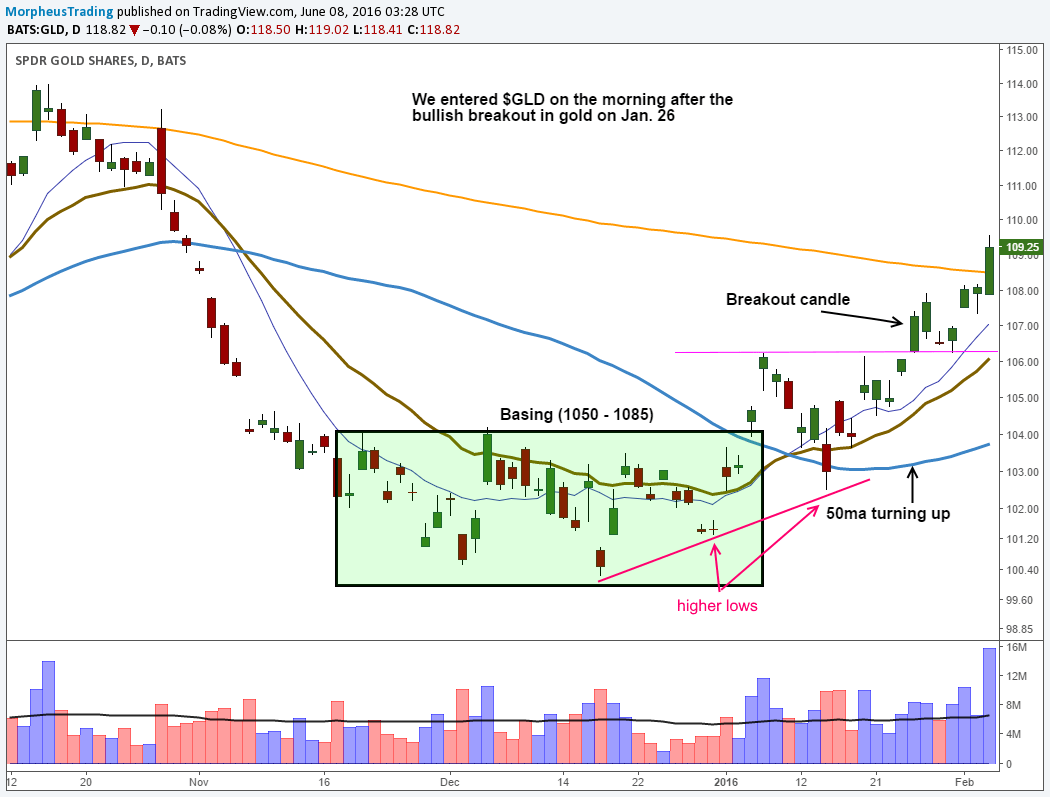
In our February 4 blog post entitled Why It Is Time To Buy Gold Right Now, we shared with you the reasons we were expecting a pickup in bullish momentum on gold ETFs.
Now, we follow up with that article to show you exactly how that bullish analysis led to a 10% percent price gain in our stock and ETF trading report over a 6-week holding period.
Continue reading to see why we bought and sold exactly when we did, AND to learn how you can still profit from the next gold rally that may be coming soon.
Golden Opportunity
Although we mentioned to subscribers they may prefer to buy a leveraged gold ETF, such as ProShares Ultra Gold (NYSE:UGL), rather than the more popular, but less volatile SPDR Gold Trust (GLD (NYSE:GLD)), our “official” newsletter trade entry was into GLD.
The daily chart of GLD below shows the technical trade setup in the gold ETF prior to our buy entry, which was on January 27 at $106.87:

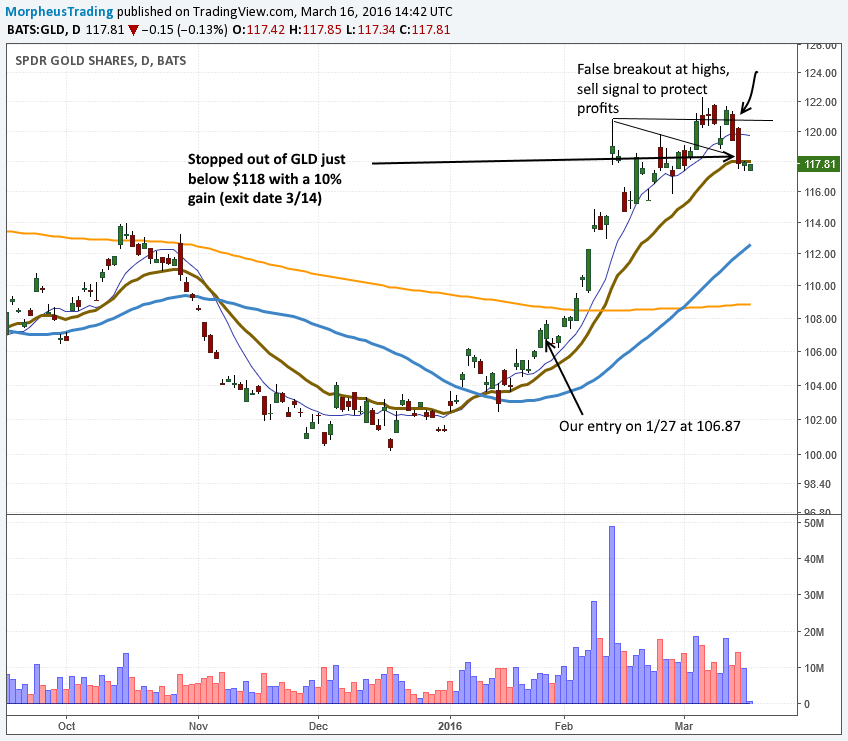
Fast forwarding six weeks later, the next chart shows the subsequent price action in GLD that followed our buy entry:

As shown on the chart above, GLD followed through to the upside within a few days of our entry, breaking out above resistance of its 200-day moving average (orange line) on substantially increasing volume (which is also bullish).
Within two weeks of our January 27 buy entry, $GLD had rallied all the way to the $121 area (approx. 13% advance beyond the entry point).
Considering this price action of the shiny commodity, our timing on the GLD buy entry was apparently quite ideal.
However, since a 13% gain in such a short timeframe is pretty large for a commodity ETF, GLD unsurprisingly entered into a multi-week base of consolidation (a correction by time).
Failed Breakout = Get Out!
After a few weeks of consolidation above the rising 10 and 20-day moving averages, GLD pushed above resistance of a short-term downtrend line (descending black line on chart above) and rallied to a high of $122 in early March.
But rather than continuing higher, bullish momentum stalled out, causing spot gold and GLD to fail the breakout attempt and close at the intraday low on March 11.
The bearish reversal candle that coincided with the failed breakout was a negative sign after an extended run, so we made a judgment call to tighten our protective stop.
That tightened stop triggered on March 14, around the $118 area, enabling subscribers who took the momentum trade to lock in a solid price gain of approximately 10% on GLD (pretty decent move for a non-leveraged ETF).
For those who missed the initial advance or those looking to re-enter, a little patience is required to wait for a low-risk entry point to develop.
Prepare For The Next Gold Breakout
Although we have been monitoring the price action of gold for a potential re-entry point, GLD has merely been stuck in a choppy, sloppy sideways range since our mid-March exit.
GLD briefly probed above the highs of its recent range to a new high in late April, but the breakout again failed.
Nevertheless, gold has once again been grinding its way back toward the upper channel of its multi-month resistance and may soon make another attempt to breakout.
Since each subsequent breakout attempt weakens price resistance by absorbing overhead supply, odds of the next breakout succeeding may be pretty good.
