f you have been following some of the research posts by some of the biggest names in the precious metals industry, you may understand “why” so many people are so excited about the opportunities in Gold and Silver recently. There are so many facets to the fundamental and emotional functions of precious metals as an industrial commodity as well as a safe-haven investment to protect against risk and to hedge against inflation. Old school traders were taught to “watch gold, oil, and bonds” for signs of concern, weakness and as a means of gauging total market sentiment. The idea behind this statement was these market tend to act as the “canary in the coal mine” in terms of fear and risk.
Recently, we posted an article that suggested Gold, Silver and many other precious metals would move in unison as this new price expansion takes place. Many of our modeling systems are suggesting that Gold will rocket well above $1400 sometime near May or June of 2019. These predictive modeling tools help us to identify opportunities and price moves well ahead of the other research firms available today. Our unique tools can actually pinpoint times/dates when breakout moves should take place and allow traders to prepare for these moves months in advance – like today.
Within this article, we are attempting to highlight the fact that any lower price rotation in Gold or Silver would be an excellent opportunity for skilled investors to target new positions or to acquire more physical material. We believe Gold and Silver will continue to rotate near current price levels over the next 30~60+ days while setting up a moderate range of rotation. Buying near the lower range of this rotation will allow traders to set up advantageous long positions ahead of the suggested breakout dates and really capitalize on any upside advance. Let’s go over some of our expectations as we prepare for this next move higher.
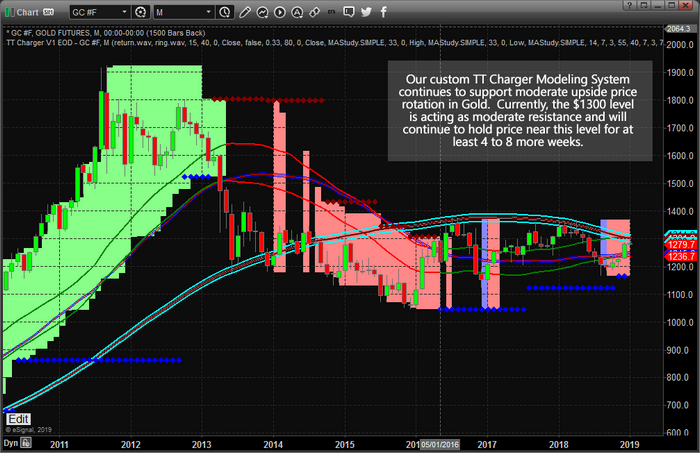
First, our TT Charger system on this Monthly chart shows that the core price support/resistance range, the CYAN, and RED narrow price channel, is currently just below $1300 and moving slightly lower. This is important because this longer-term chart is reacting to the price peak from 2012 and this price channel is currently providing a resistance zone that we expect the price to break above in a very aggressive manner. You can also see the BLUE DIAMONDS that represent current bullish price trend. Since early 2016, the TT Charger modeling system has identified Gold as being in a bullish price trend.

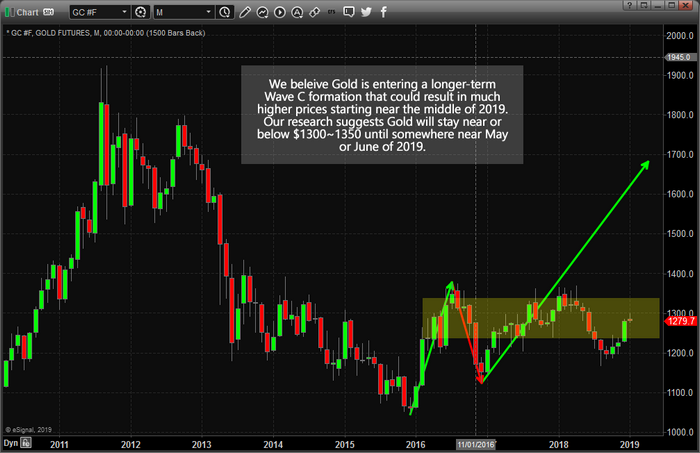
This next Monthly Gold chart is strictly price action. Our belief is that the resistance zone, highlighted in YELLOW, will act as a horizontal price channel over the next 30~60 days as price continues to build support and momentum for the upside breakout. This suggests that any price level below $1240 would provide an excellent buying opportunity for skilled traders that believe as we do. The future price rotation should continue to tighten as we near the May/June breakout date – thus, we may only have a few of these deeper low price rotation ahead.

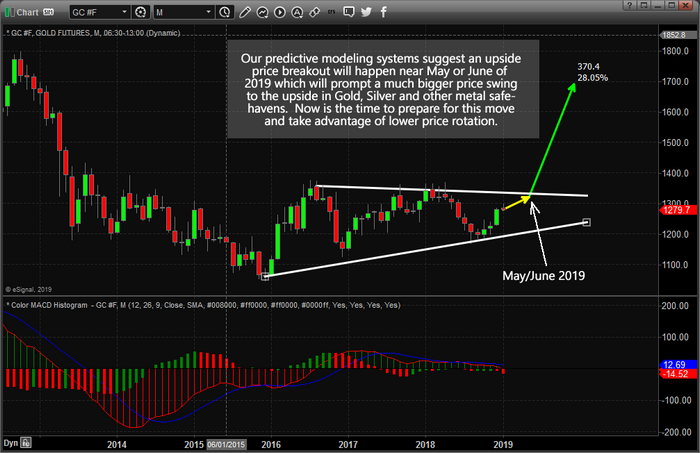
Lastly, this Monthly Gold chart highlights our expectations of a FLAG FORMATION breakout and how we believe the price will meander a bit higher, closer to the $1325 level, before the big breakout to the upside happens. You can see from the WHITE lines drawn on this chart that potential for price rotation nearing $1200 exists, yet we are not expecting any deeper price rotation over the next 2~3 months. We believe any move below $1240 would be considered a fairly deep price low and present a clear opportunity for skilled traders.
We believe Gold prices will continue to congest closer to the $1300~1320 level as we get closer to the breakout dates. Therefore, we suggest traders pay attention to price rotation as it plays out in the future for real setups and opportunities in the precious metals. The large GREEN arrow showing a potential breakout towards the $1700 level is our estimate of this potential upside move. Our predictive modeling systems are suggesting a minimum of $1550 will be reached by September 2019. Thus, we are expecting a $1600~1700 initial price advance through this upside move that would start a WAVE C price advance.

We urge all traders to pay very close attention to these moves in the precious metals. These are incredible opportunities that are setting up right before our eyes.
