🚀 AI-picked stocks soar in May. PRFT is +55%—in just 16 days! Don’t miss June’s top picks.Unlock full list

ETF Performance: Healthcare Takes The Lead

Published 02/10/2015, 06:36 AM
Updated 07/09/2023, 06:31 AM
US500
-
SPY
-
XLE
-
XLV
-
XLU
-

Healthcare Takes The Lead Among US Equity Sector ETFs

Is there a shift of leadership underway? The weakness in US utility stocks in the last two trading sessions has conceded the top spot to healthcare companies for the trailing 252-day (1 year) period. Meanwhile, energy stocks appear to be stabilizing after a wave of selling that battered the sector in recent months.

Health Care Select Sector SPDR (ARCA:XLV) is currently in the lead when measured by 1-year total return through yesterday’s close (Feb. 9). The ETF is ahead by 23.1%, which is slightly better than the 22.0% rise for the Utilities Select Sector SPDR (NYSE:XLU) over that span.

The Energy Select Sector SPDR (ARCA:XLE) is still the worst performer among US sectors, posting a mild 2.4% loss over the past 252 trading days. Compared with recent history, however, the modest setback for energy shares for the trailing one-year window represents progress compared with the steep losses that previously weighed on these firms. In fact, reviewing recent trading action suggests that the worst has passed in terms of bear raids for companies in the energy patch via XLE’s portfolio.

Meanwhile, the majority of sector ETFs are currently trailing the broad market, defined here as the (ARCA:SPY). Of the ten sector funds that comprise the S&P 500, four have generated stronger performance results over the past year.
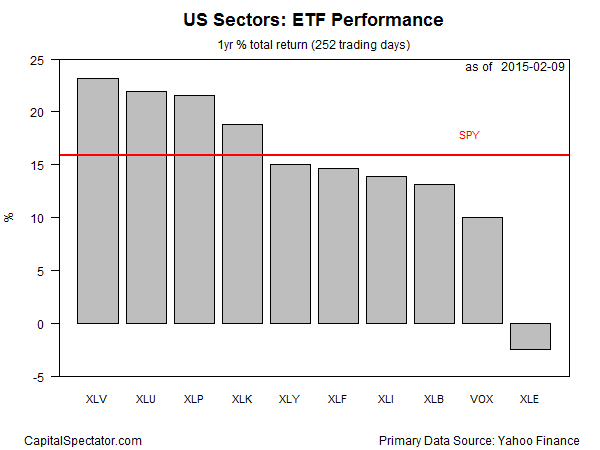
US Sectors: ETF Performance

Here’s a look at how the trailing one-year performance histories compare by indexing all the sector ETFs to 100 as of Feb. 10, 2014. Note that the last two setbacks in energy stocks (ARCA:XLE) have met resistance around the 90 mark in the chart below (purple line at bottom).
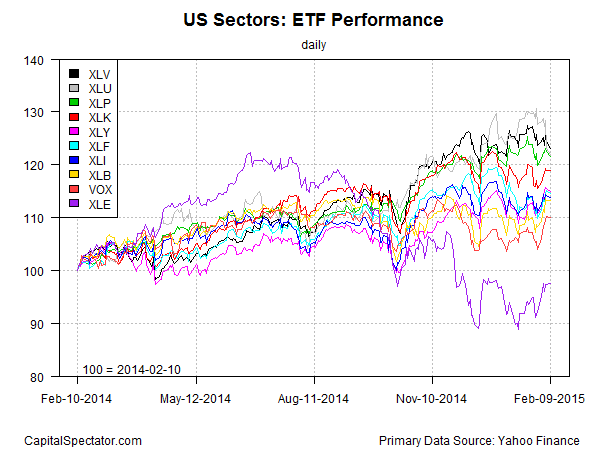
US Sectors: ETF Performance

Finally, here’s a comparison of recent momentum for the sector ETFs via current prices relative to trailing 50- and 200-day moving averages, as shown in the next chart below. For example, Energy Select Sector SPDR ETF (XLE) closed yesterday at roughly 10% below its 200-day moving average (black square in lower right-hand corner) and, in what could be a sign of an emerging recovery, 3% above its 50-day moving average (red square). Note too that XLV has slipped below its 50-day average. Perhaps that’s a sign that healthcare’s leadership is weaker than it appears.
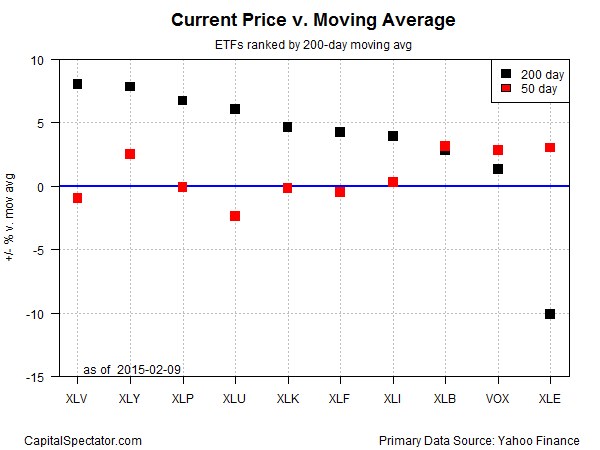
Current Price Vs moving Average

Latest comments

Loading next article…
Risk Disclosure: Trading in financial instruments and/or cryptocurrencies involves high risks including the risk of losing some, or all, of your investment amount, and may not be suitable for all investors. Prices of cryptocurrencies are extremely volatile and may be affected by external factors such as financial, regulatory or political events. Trading on margin increases the financial risks.
Before deciding to trade in financial instrument or cryptocurrencies you should be fully informed of the risks and costs associated with trading the financial markets, carefully consider your investment objectives, level of experience, and risk appetite, and seek professional advice where needed.
Fusion Media would like to remind you that the data contained in this website is not necessarily real-time nor accurate. The data and prices on the website are not necessarily provided by any market or exchange, but may be provided by market makers, and so prices may not be accurate and may differ from the actual price at any given market, meaning prices are indicative and not appropriate for trading purposes. Fusion Media and any provider of the data contained in this website will not accept liability for any loss or damage as a result of your trading, or your reliance on the information contained within this website.
It is prohibited to use, store, reproduce, display, modify, transmit or distribute the data contained in this website without the explicit prior written permission of Fusion Media and/or the data provider. All intellectual property rights are reserved by the providers and/or the exchange providing the data contained in this website.
Fusion Media may be compensated by the advertisers that appear on the website, based on your interaction with the advertisements or advertisers.
© 2007-2024 - Fusion Media Limited. All Rights Reserved.