Get 40% Off
👀 👁 🧿 All eyes on Biogen, up +4,56% after posting earnings. Our AI picked it in March 2024.
Which stocks will surge next?
Unlock AI-picked Stocks

Gold’s Momentum In Question Amid Technical Chart Uncertainty

Published 09/11/2020, 06:49 AM
Updated 09/02/2020, 02:05 AM

Hear ye, hear ye:

To those looking for the next breakout in gold, watch for this number: 1968.

Technical charts show that spot gold, which reflects trading in bullion, needs to get to that level in order to recover at least some of August's frenetic momentum that took it to record highs above $2,000 per ounce. 

Make no mistakes: $1,968 is only the beginning. There are multiple pressure points for gold bugs to cross if they wish bullion to journey back to and beyond its Aug. 7 record high of $2,073.41.

And at each level, gold bears will await—and most likely so will a vicious dollar, as the nemesis to the yellow metal often defies the odds these days in staying strong against the euro and other major rivals.

“After $1,968, spot gold’s test will be $1,993,” said Sunil Kumar Dixit, independent technical analyst and chartist for precious metals. “Whether it crosses $1,993 itself is a cryptic clue.”
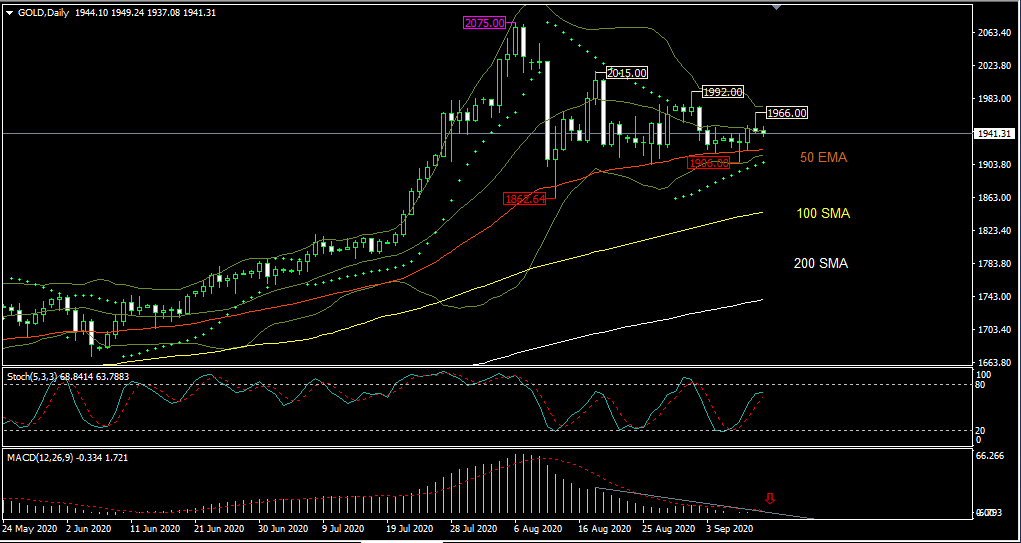
Gold Daily

All charts courtesy Sunil Kumar Dixit

In the era of the coronavirus and pandemic-related stimulus, “animal spirits” have often shaped the highs and lows in volatility-stricken financial markets. Yet, when fundamentals on their own do not produce a strong conviction, it’s back to the charts and technicals.

Another Selloff Possible In Gold

By Friday afternoon in Asia, spot gold touched an intraday low of $1,937.41 that left it at least $30 behind the nearest resistance awaiting it. Dixit pointed out:

“The market’s reaction to $1,968 will give guidance on the further course of action. But gold actually needs to close above $1,973 and cross above $1,993 to resume the bullish momentum.”

“On the downside, breaking below $1,935 and a close below $1,920 will prompt it to attempt the $1,900 handle. Further weakness can increase the chances of a lower low that may reach $1,850-$1,800.”
3rd party Ad. Not an offer or recommendation by Investing.com. See disclosure here or remove ads .

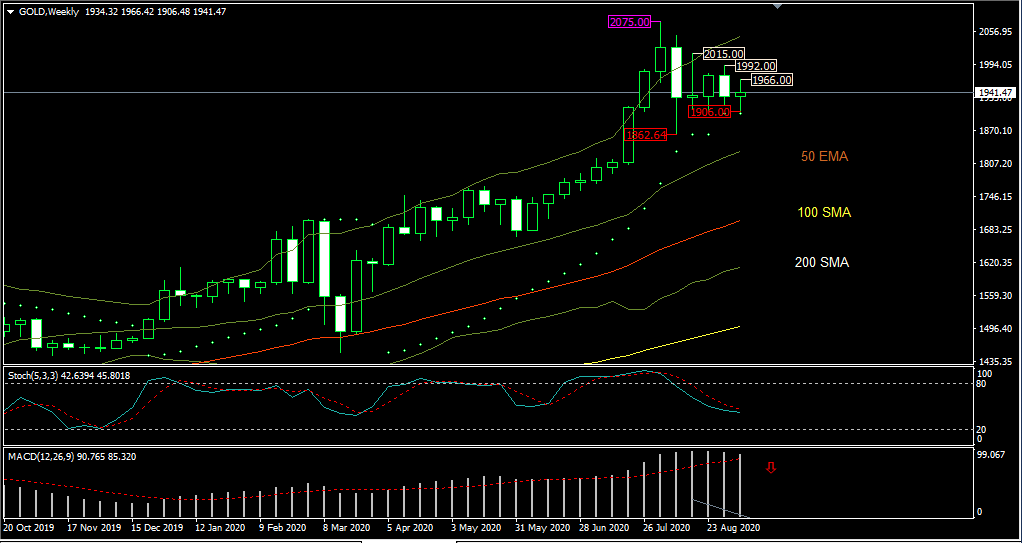
Gold Weekly

Michael Boutros shared a similar view to Dixit’s in a blog posted on DailyFX.

“A closer look at (spot) gold’s price action sees … initial resistance … at 1967/74 and 1994, both areas of interest for possible topside exhaustion if reached,” Boutrous said. ”Ultimately a break below the 2011 high-day close at 1876 is needed to suggest a larger correction is underway.”

Bottom-line, Boutrous said, gold was approaching the upper bounds of the race and consolidation range and bulls were looking for a reaction just higher. From a trading standpoint:

“If prices are indeed heading lower, a close below 1920 will be needed to shift the focus back to the downside.”

Dhwani Mehta, another gold chartist, said in a post on FXStreet that spot gold’s relative difficulty in getting past the critical 21-day Simple Moving Average at $1947 leaves it in a range within a symmetrical triangle. 

The result was a more compelling downside than before and action that suggests that the recent buying momentum has faded. Mehta added:

“Meanwhile, the daily Relative Strength Index (RSI) trades flat at the midline, indicating a lack of clear directional bias. A test of the 50-Day Moving Average at $1920 cannot be ruled out in the day ahead.”

Gold Moving To Stock Market’s Tune...Again?

Jeffrey Halley, a Sydney-based analyst for online trading platform OANDA, said investors in gold appeared to be back to tracking equity markets, noting that bullion weakened significantly in Thursday’s late trading in New York as Wall Street tumbled.

3rd party Ad. Not an offer or recommendation by Investing.com. See disclosure here or remove ads .

“A fall in equity markets on Wall Street later on Friday would likely see gold retest the $1900 to $1920 support zone,” Halley said.

“It is unlikely to break, as there appears to be plenty of willing buyers waiting patiently for dips in prices.” 

Away from bullion, U.S. gold futures for December delivery settled up on New York’s COMEX for a third day in a row on Thursday, rising an average of 0.5% each time. The latest session’s gain was $9.40 to bring a settlement of $1,964.30 per ounce. Since its last negative close of $1,937.10 on Sept. 7, December gold has risen just over $27. 

Thursday’s rise in gold futures came on the back of a volatile dollar, which initially tumbled against the euro after comments by European Central Bank (ECB) President Christine Lagarde that were deemed as hawkish for the single currency. 

The ECB did not discuss an expansion of the 1.35 trillion-euro pandemic purchase program and wasn’t eyeing a specific level for the euro as markets had thought. Lagarde’s comments added to a mostly constructive ECB policy that came with an upward 2020 GDP revision and an easing of deflationary concerns. 

The ECB action drove the euro up and the Dollar Index down below the key 93-handle, before the greenback clawed back early losses to return to the positive late afternoon in New York.

The Dollar Index, which has stubbornly held to its bullish 93-handle despite a new Federal Reserve initiative for inflation, could cause more problems for gold. 

3rd party Ad. Not an offer or recommendation by Investing.com. See disclosure here or remove ads .

ECB, Fed Direction To Lead Gold

The Fed meets next week for its monthly interest rate decision and dovish comments by the central bank could drive the Dollar Index lower and gold higher. Notwithstanding that, some are actually expecting the greenback to forge new highs.

"We expect that (a) broad 1-2 month USD rally will begin this week,”  Bank of America said in a note Thursday. BofA adds:

"Looking forward, we expect USD to rally into the US election on a rebuilding of FX risk premium amid elevated downside market risk, one-way positioning, improved relative US data outlook and bullish seasonals. The ECB this week could be a catalyst." 

The ECB will be having a second round of meetings and speeches on Friday that could strengthen the euro. Alternatively, the August reading for the U.S. Consumer Price Index could boost the dollar if the data came in above the 0.3% forecast for the month.


Disclaimer: Barani Krishnan does not own or hold a position in the commodities or securities he writes about.


Latest comments

This week, gold and silver can work in limited scope.The Commodity Futures Trading Commission's weekly Commitments of Traders (COT) report provides this weak seems neutral trends. It can also mean that the commodity is now looking for a new path, What will be the new trajectory of boom or slowdown ? Maybe by the end of this week clues can be found During this period, the movement of the commodity can be based on pure macro economic data, global economic activity and political statements.
great
Thanks for the report Barani. Glad you included rising USD because that's going to be an even more important factor w.r.t. gold going forward.
Hello Barani! The daily chart is forming a descending triangle with suport at 1910, the weekly chart is forming a doji - similar setup for the Euro- not looking good overall for bulls (me included ) Im pulling the plug
Don't blame. It's really struggling to move forward in the mid 1900 levels. Think it's lost the mojo from August, for now that is.
good article. what's the view on gold for say 2 to 3 years from now? especially when all printing presses are doing overtime - all at once.
Rajesh, it could be in a $2,500-$3,500 range. I know that's a big, but I'm being honest in admitting that I don't have a finer read than that.
Thank you Barani for the interesting article
Thanks much, Abdulrahman. All the best and a happy weekend ahead.
Thanks Barani, good article!
Thanks much, Falec. All the best and a happy weekend ahead.
Thank you so hard to tell with the wAy the market is moving
The market is always free to ignore the tarot-card readings of "independent technical analysts".  And it often does.  Investing.com is very chart-happy.
 Not really sure what to make out of this, considering I hadn't done what you "expected", yet having "cemented that habit". On top of that, an "all the best to you!" sign off. You castigating me for just laying out to you what I've said in the story?
   I really did mean to be clear:  I thought you'd get extra-defensive or even hostile.  You didn't, instead acknowledging my point for the most part.  You then justified your resort to charts and technicals pretty well.  (Maybe I had skimmed a little hastily the part of the column where you already did that.)  So, no castigation.  Not at all, quite the opposite.  (In your reply just now, you took your turn mistaking me! lol)  Keep writing, I'll keep reading.  Cheers.
 Wow, that's a relief! Thanks, mate. Really, it is never my intent to be rude to my readers or overly defensive in the face of criticism. I'm happy to hear what people have to say, provided they do so politely. To me, courtesy is a two-way street. The tone of my reply is always based on the original missive I get. Most of my readers are great and I have a fantastic rapport with many of them. Thanks again. I truly appreciate you for taking the time to write and being so articulate with the point you had to make. Bests - B
I stay bullish on gold. We are clearly UP this week. Even a blind guy can see this. Of course there is some resistance at 1950 usd. Once 1963 is broken (one of these days) gold price will continue its bullish pattern.
 That's what Philip means: Too obvious that even the blind won't miss it. Odd phraseology maybe to suggest that the blind can see, but I get his point :)
  Thanks for your explanation. I thought what I wrote was crystal clear . Maybe in a few minutes I'll have to explain what means "crystal clear" ...
 Ha ha ... Philip, yes, clarity: Our readers demand it! But you know what? Having dealt with so many of our readers, I sometimes understand that they are all different. Most people are very well meaning. Some of course like to be sarcastic. My reply is always based on the tone of the original missive :)
Thank you
Thanks much, Ko Ko. All the best and a happy weekend ahead.
even with all of the selling in equities gold is only down like $10. Very strong support here, one of these days it will rise hard while stocks fall.
I think you're right, i sold all my positions.
 I sold only the one in Silver to be honest. Because Silver is much more connected to stocks than Gold, as far as I know silver is more used in the industry (terminal plating for connectors to carry more current, etc). I kept gold, I do not have a large amount, but I am aware of the risks anyway. Plan to load more later in time.
 I like Chinese Flu's avatar, Falec :)
hii
Gold bears will need to release the "Kraken" to get prices going down because this thing is not budging one inch. Great article, thank you.
Thanks much, Brass Tacks. All the best and a happy weekend ahead.
it's a reversal triangle with 1920 as strong resistance but a small break of that mark will push it down hard
support, sorry
 Yes, you're right. It's really tenuous, all support levels above 1930, though they are holding up today.
Thanks You.
Thanks to you, Zaw Zaw, for reading. All the best and a happy weekend ahead.
Risk Disclosure: Trading in financial instruments and/or cryptocurrencies involves high risks including the risk of losing some, or all, of your investment amount, and may not be suitable for all investors. Prices of cryptocurrencies are extremely volatile and may be affected by external factors such as financial, regulatory or political events. Trading on margin increases the financial risks.
Before deciding to trade in financial instrument or cryptocurrencies you should be fully informed of the risks and costs associated with trading the financial markets, carefully consider your investment objectives, level of experience, and risk appetite, and seek professional advice where needed.
Fusion Media would like to remind you that the data contained in this website is not necessarily real-time nor accurate. The data and prices on the website are not necessarily provided by any market or exchange, but may be provided by market makers, and so prices may not be accurate and may differ from the actual price at any given market, meaning prices are indicative and not appropriate for trading purposes. Fusion Media and any provider of the data contained in this website will not accept liability for any loss or damage as a result of your trading, or your reliance on the information contained within this website.
It is prohibited to use, store, reproduce, display, modify, transmit or distribute the data contained in this website without the explicit prior written permission of Fusion Media and/or the data provider. All intellectual property rights are reserved by the providers and/or the exchange providing the data contained in this website.
Fusion Media may be compensated by the advertisers that appear on the website, based on your interaction with the advertisements or advertisers.
© 2007-2024 - Fusion Media Limited. All Rights Reserved.