Today is options expiry day for gold. That’s almost certainly the reason for gold’s pullback today, after it staged a powerful rally yesterday.
A pause in the price action is normal around these expiry events. The October options contract is expiring, which is recognized by traders as an important one.
Traders will now focus on December options.
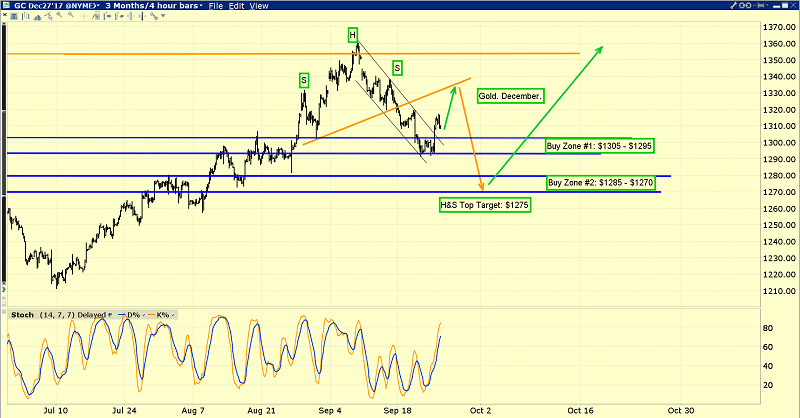
This is the short-term gold chart.
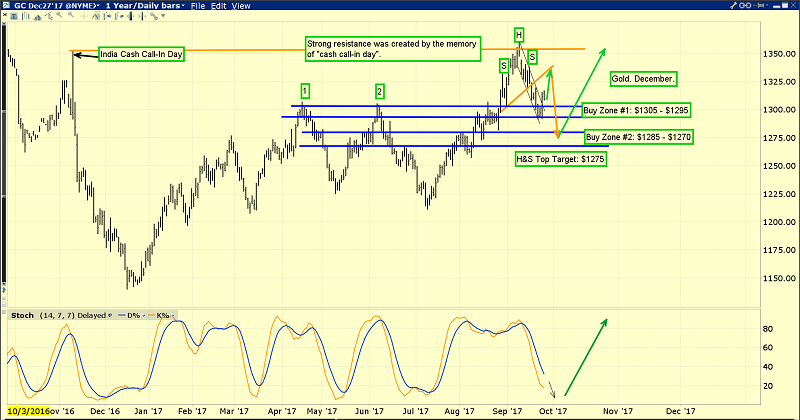
A medium-term view of the price action.
From a technical perspective, all the current price movement in the gold market appears to be “textbook” action. To summarize the recent movement: Gold burst above the $1305 area highs and surged to the “Call-In” day highs in the $1352 area.
I issued a “book profits now” call as that happened, and the rally promptly died. The pullback took gold back to the breakout zone in the $1305 area.
Yesterday, gold staged its first rally from that support zone. Gold may soon pull back deeper into that support zone before launching what should be a successful rally above the call-in day resistance zone at $1352 - $1362.
I’ve laid out two buy zones for investors who want to position themselves to participate in the anticipated breakout above $1362.
All pullbacks can make investors nervous, and those nervous investors should look at put options for insurance (both emotional and financial).
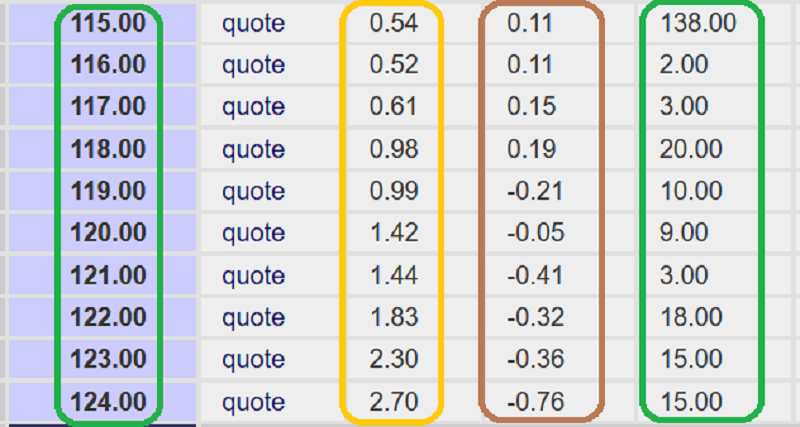
That’s a snapshot of the strike price, closing price, change in price, and trading volume for GLD-nyse put options.
These are December options. Different contract months are available and they can be bought through most stock brokers. Send me an Email to stewart@gracelandupdates.com if you want more information about protective put options and I’ll send you a tactical video. Thanks.
Buying some put options at the same time as buying long positions in gold, silver, and related stocks can help amateur investors to buy serious price weakness, yet still get a good night’s sleep.
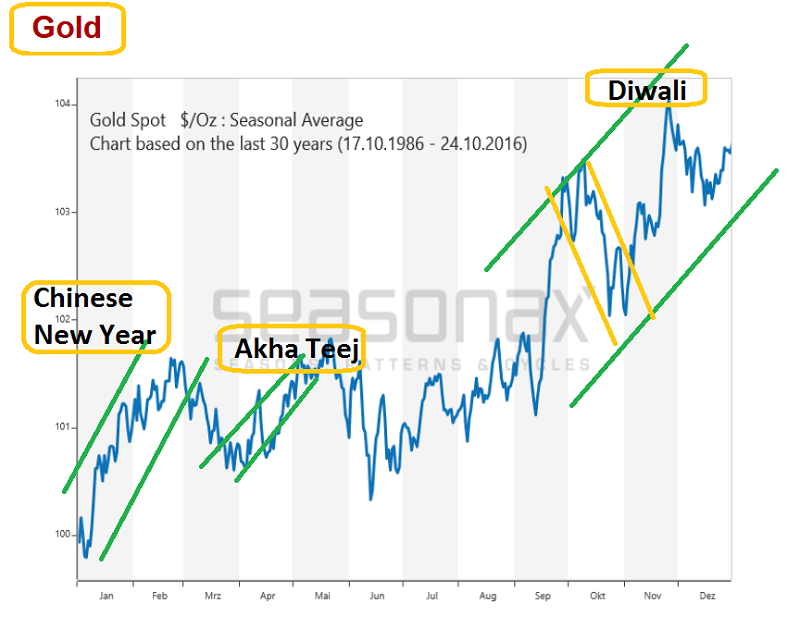
I’ve annotated this Dimitri Speck seasonal action gold chart. In the case of gold price seasonality, history doesn’t always exactly repeat, but it certainly does rhyme. Note the short term peak that often occurs at the end of September.
October is generally a pullback month ahead of Diwali, but that pullback may have started a bit earlier than usual this year. So, it should end earlier too, probably within about two weeks. There’s an outside chance that it’s already ended, but I wouldn’t bet real money on that idea.
My $1305 - $1295 and $1285 - $1270 buy zones should be the focus of gold bugs for now.
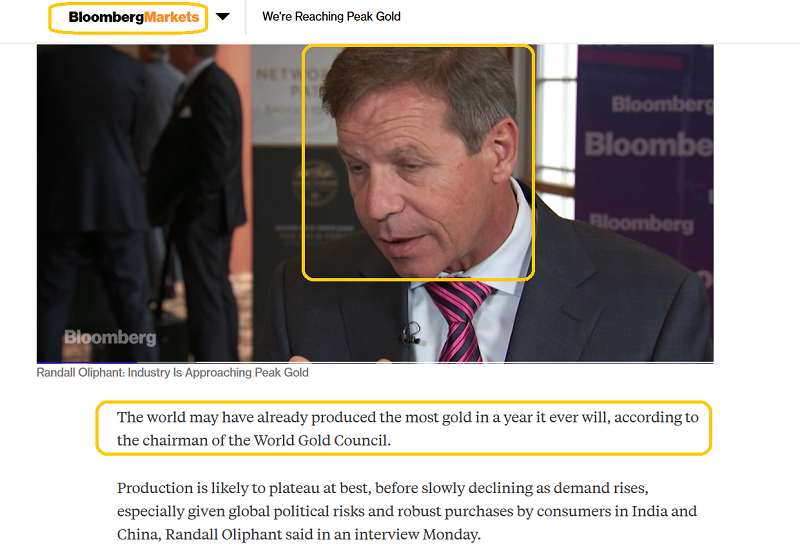
The head of the World Gold Council outlines the case for “peak gold,” and he predicts gold will move to $1400 in 2018 and to all-time highs in “the medium term.”
He may or may not be correct that the world will never produce as much gold as it produces now, but he’s a very influential man.
So, the question isn’t so much whether “peak gold” is real, but whether institutional money managers think it’s real or even partially real, and they do appear to be believers!
I predict they will move substantially more money into gold stocks in 2018 than they are moving now, based on the view that supply is unlikely to rise much, if at all.
My personal focus on all price weakness since 2014 has been gold stocks more than bullion. I will also note that gold mining exploration budgets have fallen about 70% since 2012. It takes a long time to put a gold project into production. All the exploration done in the 2012 period doesn’t seem to be bearing much low hanging fruit in terms of viable new projects.
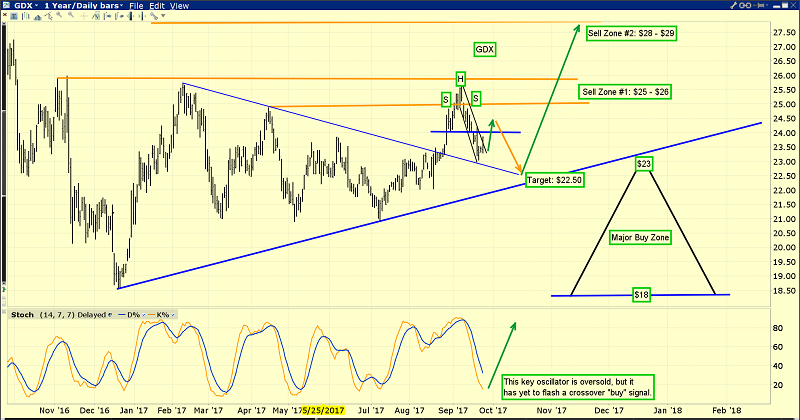
This is an interesting VanEck Vectors Gold Miners (NYSE:GDX) chart. GDX has been staging numerous technical breakouts to the upside, and the latest one is from a large symmetrical triangle.
The apex of that triangle sits in the $22.50 area. Once option expiry day is out of the way, there is still the US jobs report to deal with next week (October 6, 2017). Gold and gold stocks should make a meaningful seasonal low around that rough time frame. From there, I expect gold to begin a trending move higher into 2018, rising up above key resistance at $1392 and steadily rallying towards $1523.
GDX should easily hit $37 in 2018, with $55 also being a possible target zone if Western money managers continue to allocate money to the SPDR fund as they have in recent months.
Stewart Thomson is a retired Merrill Lynch broker. Stewart writes the Graceland Updates daily between 4am-7am. They are sent out around 8am-9am. The newsletter is attractively priced and the format is a unique numbered point form. Giving clarity of each point and saving valuable reading time.
Risks, Disclaimers, Legal
Stewart Thomson is no longer an investment advisor. The information provided by Stewart and Graceland Updates is for general information purposes only. Before taking any action on any investment, it is imperative that you consult with multiple properly licensed, experienced and qualified investment advisors and get numerous opinions before taking any action. Your minimum risk on any investment in the world is: 100% loss of all your money. You may be taking or preparing to take leveraged positions in investments and not know it, exposing yourself to unlimited risks. This is highly concerning if you are an investor in any derivatives products. There is an approx $700 trillion OTC Derivatives Iceberg with a tiny portion written off officially. The bottom line:
Are You Prepared?
