
Gold’s third consecutive week of gains led the price of the yellow metal to the vicinity of the psychological $1300 mark earlier today. On December 14th, the price of gold fell below $1233, but according to experts, a combination of economic uncertainty, trade worries and rising interest rates sparked fear in investors, who hurried to buy safe haven assets.
The truth is, every time gold rises, some kind of a safe haven buying is usually going on. Therefore, it is very easy and convenient to explain a surge in gold prices after the fact, but hardly anyone expects it in advance. The problem is that traders cannot profit from yesterday’s gains. In order to succeed they have to be ahead of the market, not behind it.
The Elliott Wave Principle can be very helpful for that same task. For example, take a look at the chart of gold below. Our subscribers received it before the market opened on Monday, December 17th, 2018. As visible, gold’s current surge is the result of an Elliott Wave setup from three weeks ago.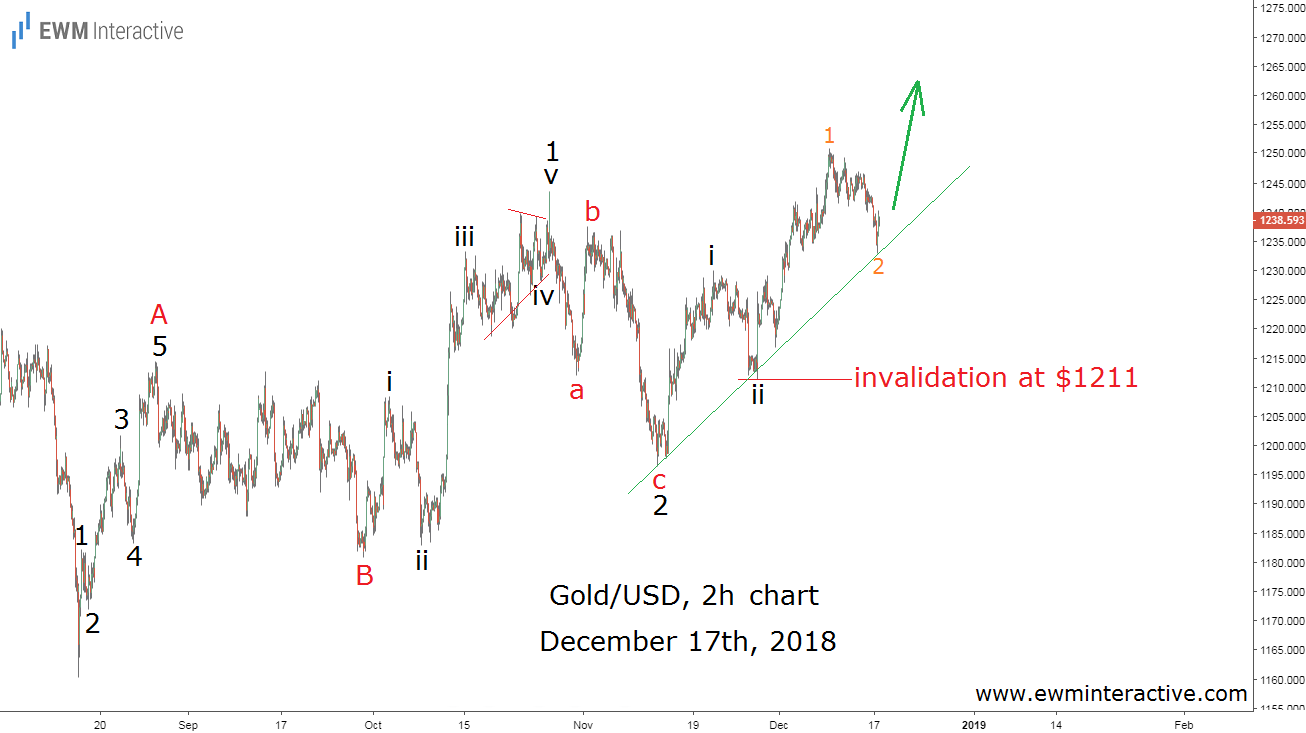
The bigger time frames, which are also included in our analyses, suggested that $1300 was a reasonable target for the bulls. The 2-hour chart of XAUUSD revealed the details of the structure of the entire recovery from the bottom at $1160 in August, 2018. There were two impulsive rallies in waves A and 1, followed by two corrective pullbacks in waves B and 2, respectively.
All this made us think the recovery from the bottom of wave 2 at $1196 represents a sequence of first and second waves within wave 3 of C. Since the third wave is usually the fastest and strongest part of the impulse pattern, it made sense to stay with the bulls at least as long as $1211 was intact. The rising trend line drawn through the last three lows also supported the positive outlook. At the start of 2019, gold is already knocking on $1300.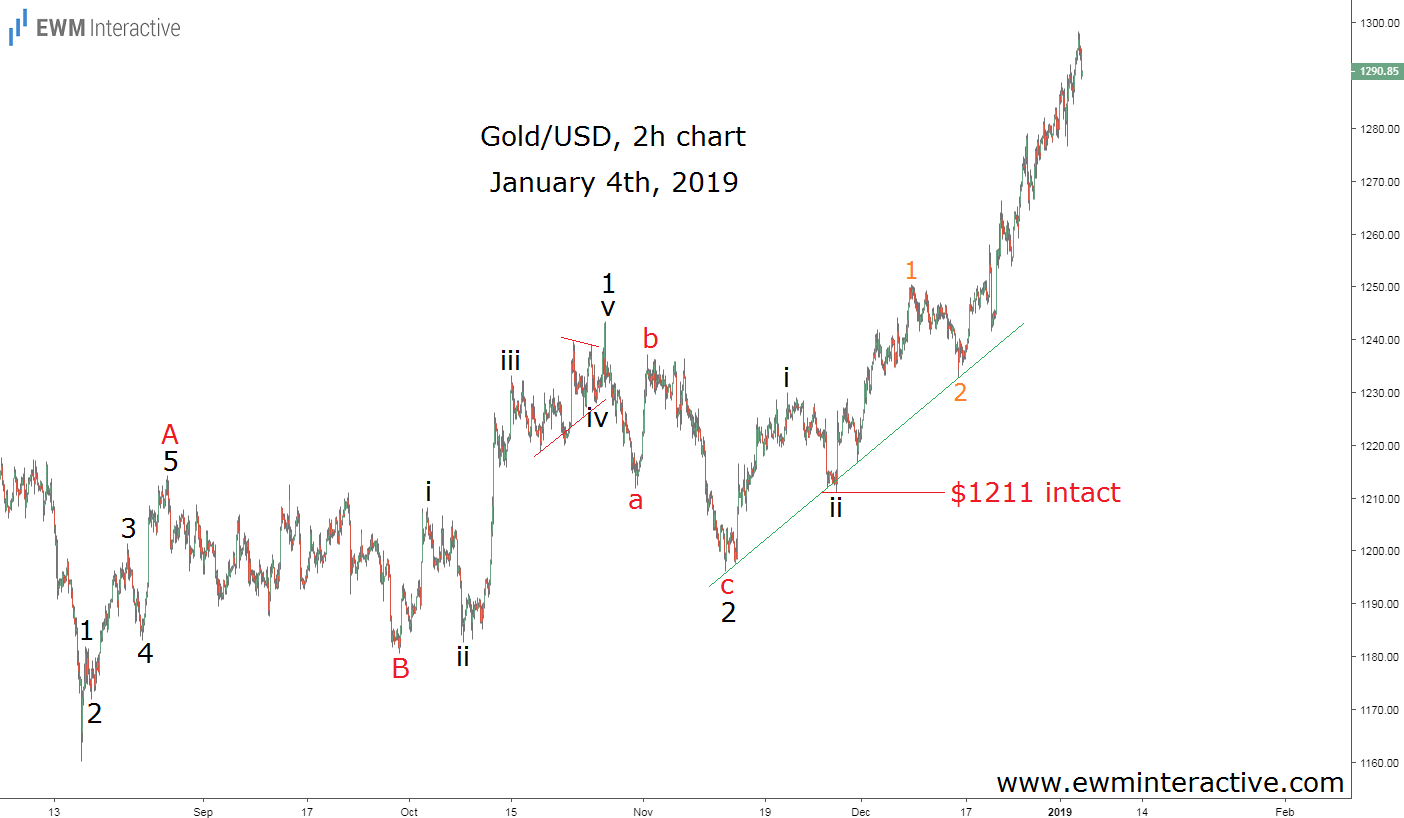
Gold headed north right away and never came even close to $1211. Depending on how you look at it, three weeks can be a lot of time, but that is what it took for this trading setup to bear fruit. Elliott Wave trading is based on price patterns, which take some time to develop. Therefore, patience is required for these patterns to give results, as well.
In this respect, Elliott Wave traders fall into the “position traders” category, because they are willing to keep a position open for days and weeks. In addition, Elliotticians do not rely on external factors such as news, events or announcements by politicians. We prefer to extract information from the market itself. In this case, it was sending a bullish message long before gold’s “safe haven” status became fashionable in the media again.