
GOLD edged lower as investors stay cautious ahead of U.S. data
Macroeconomic overview: A gauge of U.S. factory activity slid from a near three-year high in July amid a slowdown in new orders and consumer spending barely rose in the prior month, setting the stage for a moderate economic expansion in the third quarter. That was reinforced by other reports on Tuesday showing motor vehicle sales in July recorded their biggest year-on-year drop in nearly seven years. A plunge in construction spending in June suggested the government could cut its second-quarter GDP growth estimate.
The Commerce Department reported last week that the economy grew at a 2.6% annual rate in the April-June period, accelerating from the first-quarter's tepid 1.2% pace. The Institute for Supply Management (ISM) said its index of national factory activity fell to 56.3 last month from 57.8 in June, which was the highest level since August 2014. A reading above 50 in the ISM index indicates an expansion in manufacturing, which accounts for about 12% of the U.S. economy. Manufacturing is slowing as a boost from the energy sector ebbs after a burst in oil well drilling activity. It is also being hurt by declining automobile production as companies respond to falling sales that have left them with an inventory bloat. Motor vehicle output has dropped for three straight quarters.
In June, personal income was unchanged.
That was the weakest reading since a 0.1% dip in November 2016 and followed a 0.3% increase in May. Wages and salaries rose 0.4% in June. Income at the disposal of households after accounting for inflation fell 0.1%, the largest decrease since last December.
In another report, the Commerce Department said construction spending in June tumbled 1.3%, to the lowest level since September 2016.
Construction spending was weighed down by a 5.4% plunge in public investment, which was the biggest decline since March 2002. The drop occurred across federal, state and local governments. Hopes that President Donald Trump's vow to boost infrastructure spending would kick off a construction boom have now largely faded.
Investors are waiting toady for the U.S. ADP jobs report and comments by San Francisco Fed President John Williams and Cleveland Fed chief Loretta Mester. Investors are probably looking for some further evidence of stronger inflation numbers before they get a little bit more optimistic about a rate hike, which would clearly be a headwind for gold prices if the probability of that starts to rise.
Technical analysis: Spot gold may break support at 1,264 per ounce and fall to the next support level at 1,258, as suggested by its wave pattern and a Fibonacci retracement analysis 
Short-term signal: We keep our bid at 1,255.00
Long-term outlook: Further weakening of the USD and break above 1,295.00 resistance may open the way to continuation of bullish trend in the long term.
NZD/USD weakens on weaker jobs report from New Zealand
Macroeconomic overview: The New Zealand dollar slipped to one-week lows on Wednesday after data showed surprisingly weaker employment and wage growth in the second quarter.
Employment rolls shrank 0.2% in the second quarter, with 4k fewer people employed, after six consecutive quarters of gains. That translated into a 0.4 percentage point quarter-on-quarter drop in the employment rate. Market expectations were centred on employment rising 0.7% in the June quarter. What was even more worrying for policymakers is the sluggish pace of wages growth, with quarterly wage inflation at 0.4% unchanged from the first quarter. At 1.6%, annual wage inflation was also lower than consumer price inflation of 1.7% in the second quarter.
The Reserve Bank of New Zealand has expressed concern that robust economic growth and industry complaints of labour shortages in high-skilled sectors such as technology and construction, have not led to broad-based growth in wages. This release reinforces the idea that the RBNZ will be in no rush to raise interest rates any time soon.
The data also showed the unemployment rate slipped, in line with expectations, to 4.8%, lows last seen in the third quarter of 2016. The RBNZ, which is due to meet on August 10 for a monetary policy decision, slashed rates throughout 2016 to the current record lows of 1.75% in November. The central bank has signalled it will stand pat, possibly until 2020, to boost inflation. But in our opinion a rate hike in late 2018 is likely.
The surprise contraction in jobs and listless wage inflation spooked investors, sending the NZD to a one-week low of 0.7417 from around 0.7466 just before New Zealand’s Statistics released the data.
Technical analysis: The NZD/USD is testing 14-day exponential moving average at 0.7428 now. A close above this level would keep a bullish trend intact. Another important support level is 23.6% fibo of May-July rally at 0.7384 
Short-term signal: We used today’s corrective move to open a long position at 0.7445.
Long-term outlook: Bullish
TRADING STRATEGIES SUMMARY: 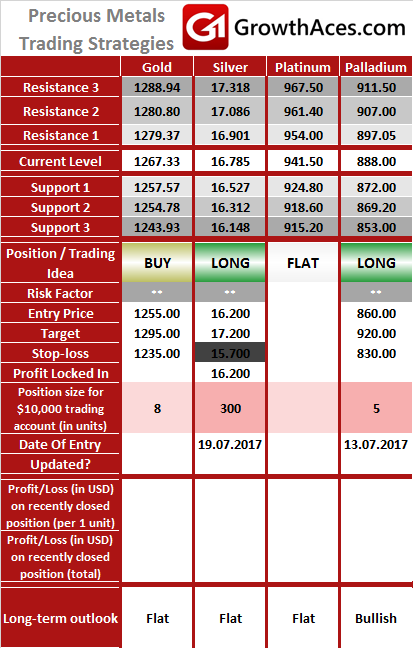
How to read these tables?
1. Support/Resistance - three closest important support/resistance levels
2. Position/Trading Idea:
BUY/SELL - It means we are looking to open LONG/SHORT position at the Entry Price. If the order is filled we will set the suggested Target and Stop-loss level.
LONG/SHORT - It means we have already taken this position at the Entry Price and expect the rate to go up/down to the Target level.
3. Stop-Loss/Profit Locked In - Sometimes we move the stop-loss level above (in case of LONG) or below (in case of SHORT) the Entry price. This means that we have locked in profit on this position.
4. Risk Factor - green "*" means high level of confidence (low level of uncertainty), grey "**" means medium level of confidence, red "***" means low level of confidence (high level of uncertainty)
5. Position Size (forex)- position size suggested for a USD 10,000 trading account in mini lots. You can calculate your position size as follows: (your account size in USD / USD 10,000) * (our position size). You should always round the result down. For example, if the result was 2.671, your position size should be 2 mini lots. This would be a great tool for your risk management!
Position size (precious metals) - position size suggested for a USD 10,000 trading account in units. You can calculate your position size as follows: (your account size in USD / USD 10,000) * (our position size).
6. Profit/Loss on recently closed position (forex) - is the amount of pips we have earned/lost on recently closed position. The amount in USD is calculated on the assumption of suggested position size for USD 10,000 trading account.
Profit/Loss on recently closed position (precious metals) - is profit/loss we have earned/lost per unit on recently closed position. The amount in USD is calculated on the assumption of suggested position size for USD 10,000 trading account.
Source: GrowthAces.com - your daily forex signals newsletter