Get 40% Off
👀 👁 🧿 All eyes on Biogen, up +4,56% after posting earnings. Our AI picked it in March 2024.
Which stocks will surge next?
Unlock AI-picked Stocks

Gold Can’t Wait To Fall – Even Without USDX’s Help

Published 04/30/2021, 12:47 PM
Updated 05/14/2017, 06:45 AM

Gold started its decline without anyone’s assistance. And when the USDX takes off, that downhill tumble can only increase.

The USDX declines and the precious metals sit by idly, twiddling their thumbs. If they had the strength that’s being talked about, they should be soaring by now, or getting ready to. So, what’s their problem?

In the previous days, I discussed the signals coming from the precious metals market or for the precious metals market, as they kept on emerging, and we just received yet another round of indications. And yes, they also confirm the bearish outlook for the following weeks – or a few months.

Let’s start by looking at the USD Index.
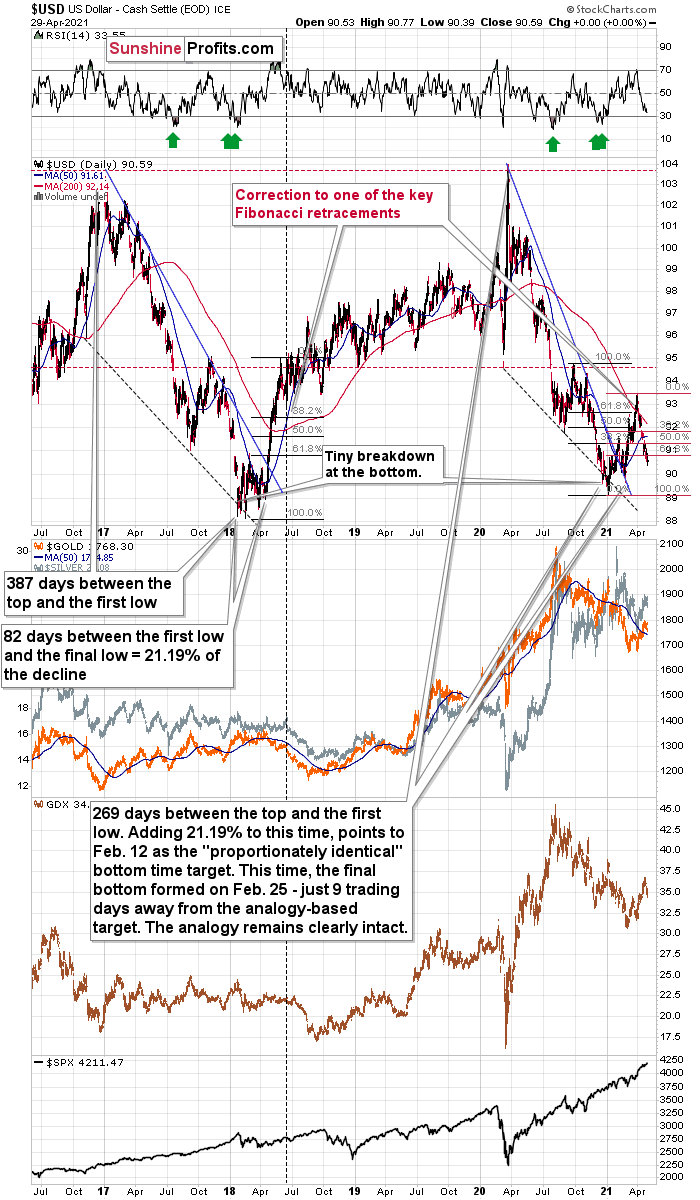
USD Daily Chart.

On the above chart you can see that this week, the USD Index broke to new monthly lows. And you can also see that gold didn’t move to a new monthly high. In fact, it was not even close to doing so – it just closed the day below $1,770. This is a clearly bearish sign for gold.

And what about the USD Index?
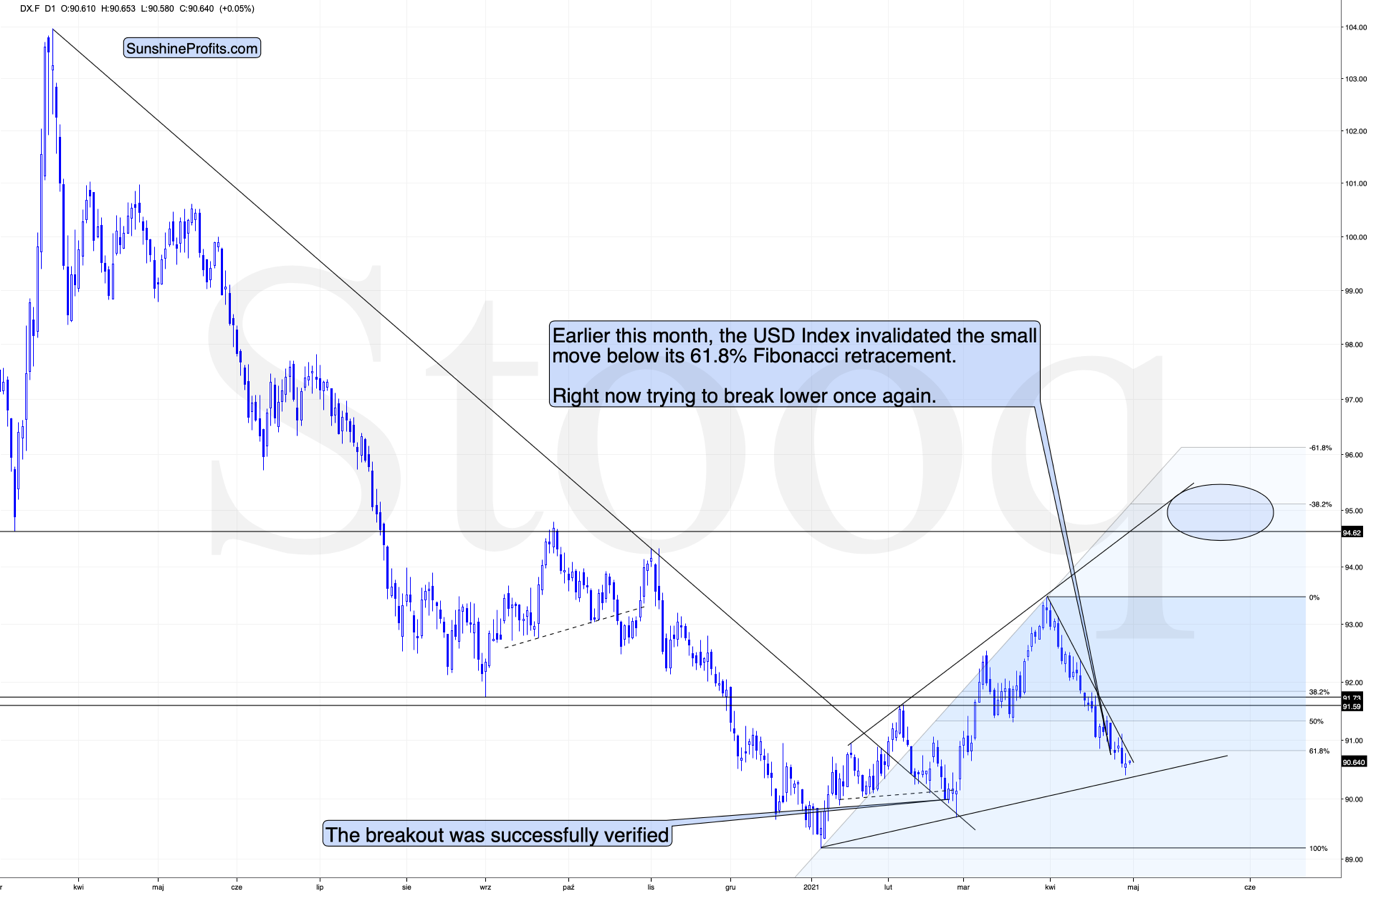
4-Hour US Dollar Chart.

On the above 4-hour USD Index chart we see that the previous short-term breakout was invalidated, which triggered a substantial sell-off, but….

Whatever was likely to happen based on this invalidation seems to have already happened. And it seems that we’re about to see another attempt to break higher.

Will the USD Index be successful this time? That’s quite likely, but that’s not the most important thing from the precious metals investors’ and traders’ point of view.

3rd party Ad. Not an offer or recommendation by Investing.com. See disclosure here or remove ads .

PMs Play The Fiddle While USDX Burns

The key thing is that during the recent declines in the USDX (and during the move to new highs in case of the general stock market), gold, silver and mining stocks didn’t soar. They “should have” if the situation was normal or bullish. They declined instead, which means it’s highly likely that even if the USD Index doesn’t break out now (but a bit later), the decline in the precious metals will not be avoided but only delayed.

In fact, to be more precise, it’s unlikely to be delayed as well. What might be delayed is the increase in the pace at which gold, silver and miners are about to slide. After all, gold and gold stocks are already moving lower (while silver is trading sideways).

By the way, silver’s lack of movement recently is perfectly normal in the early stage of a decline – the white metal tends to catch up big-time in the final part of a given move.
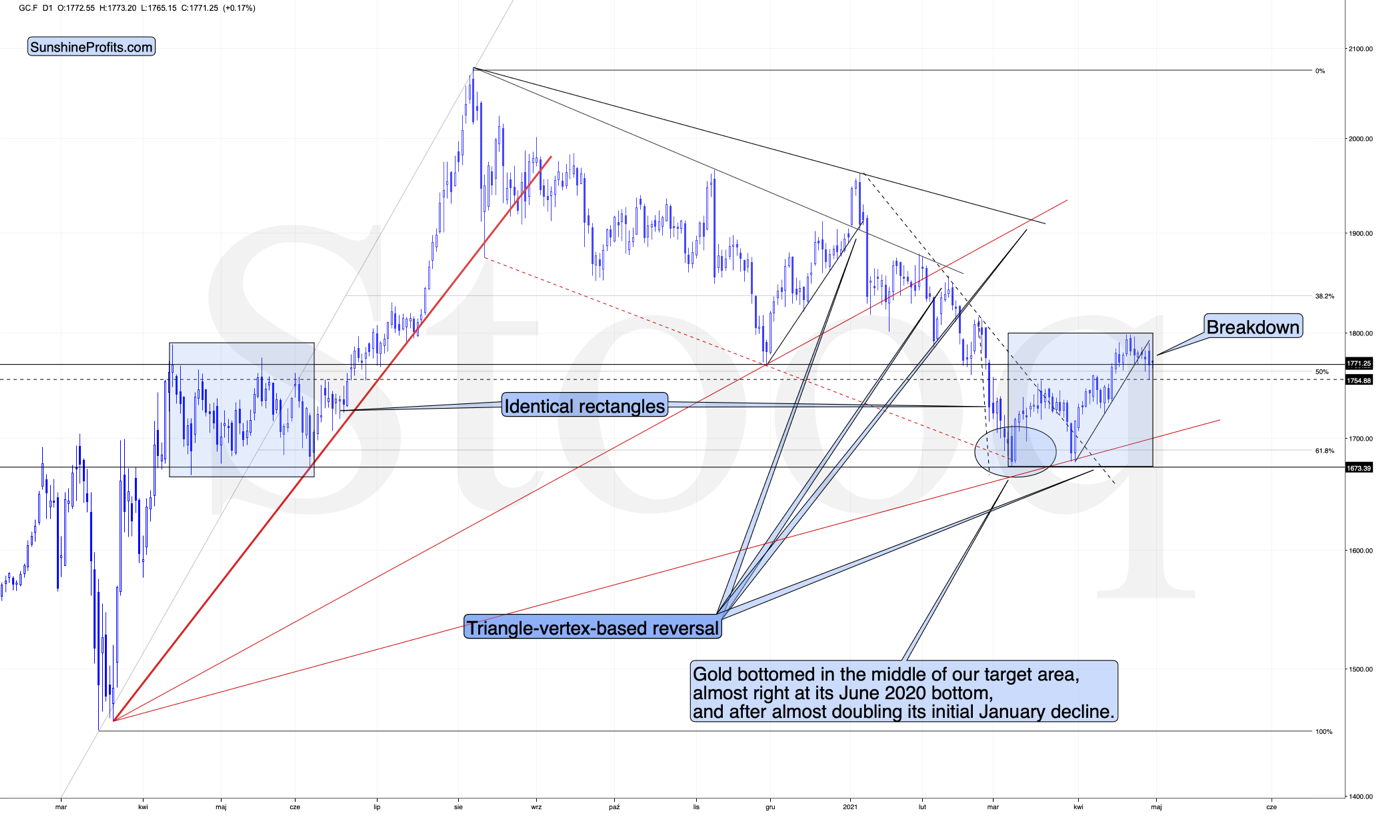
Gold Daily Chart.

On the above gold chart, you can clearly see how gold moved back up to its rising short-term resistance line this week, and – instead of invalidating the breakdown – it bounced from it and declined once again. This is what verifications of breakdowns look like.

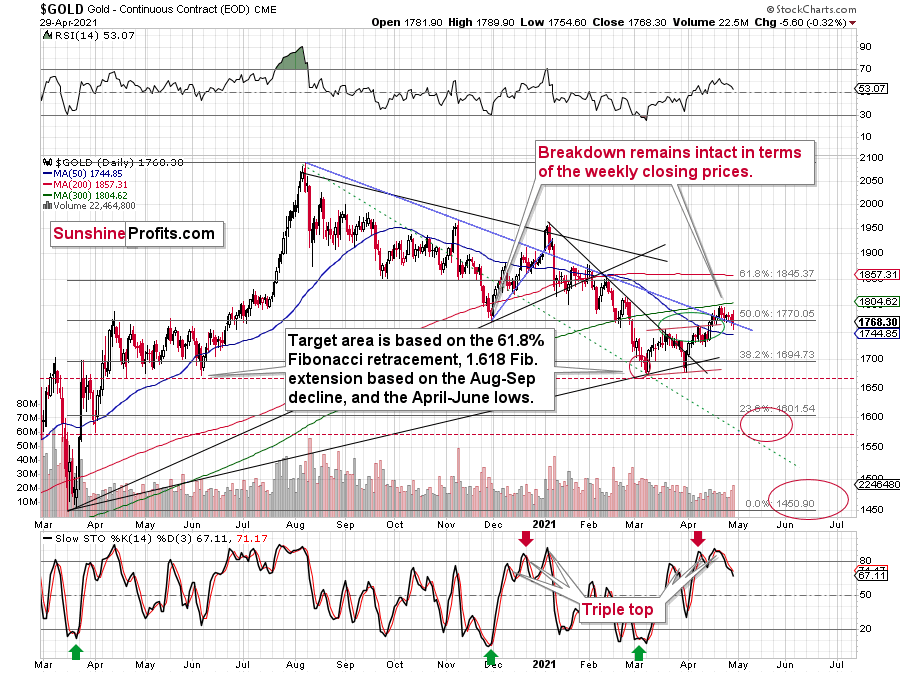
Also, let’s keep in mind that the situation now seems to be a mirror image of what we saw in April–June 2020, and at the same time it’s somewhat similar to what we saw at the beginning of the year. You can see the former (the rectangles are identical) on the above chart, and you can see the similarity to the early January action below.
3rd party Ad. Not an offer or recommendation by Investing.com. See disclosure here or remove ads .

Gold Daily Chart.

Just as was the case in early January, we first saw a pause – a rebound – and the decline continued only thereafter. It seems that the Jan. 7, 2021, price action is quite similar to what we saw yesterday (Apr. 29). Moreover, please note that both happened just above the declining blue support line. It was the final pause before the move higher was invalidated.

Having said the above, let’s move to gold stocks:
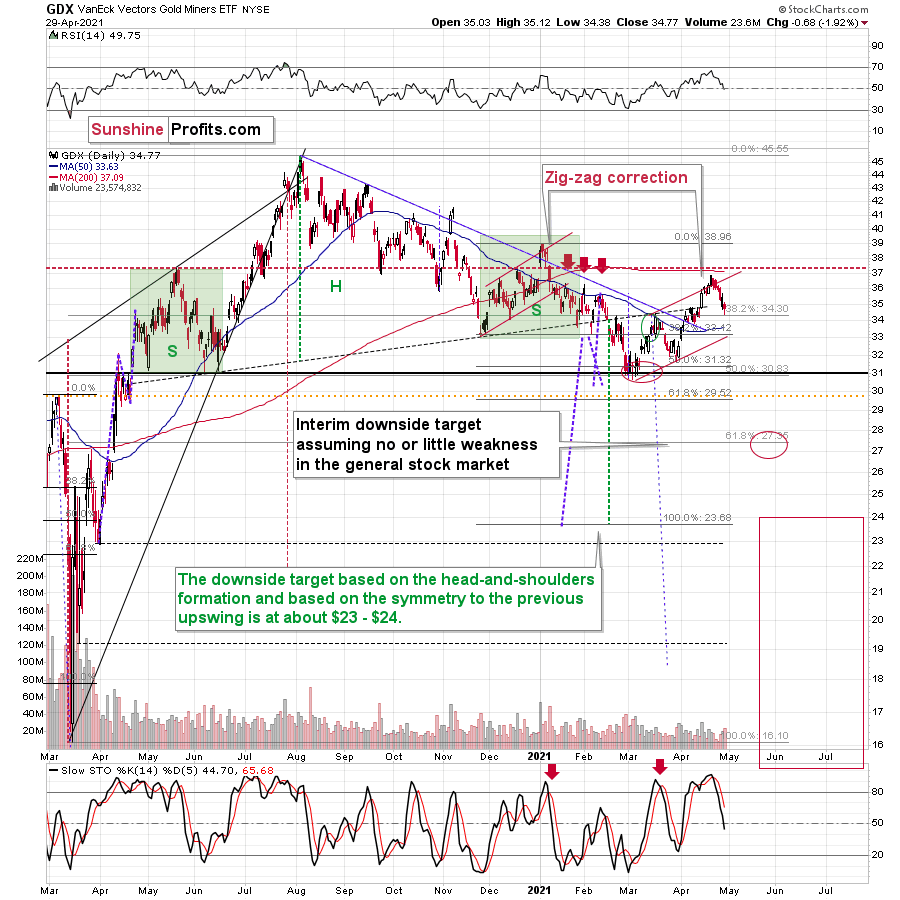
GDX Daily Chart.

Miners: GDX And GDXJ ETFs

In yesterday’s analysis, I described the GDX’s previous performance in the following way:

Gold stocks’ intraday recovery that we saw yesterday may seem profound, but not if we consider what happened in the USD Index and the general stock market. The former declined substantially while the latter was close to its all-time highs. This is a combination of factors that “should have” made gold miners move to new highs – and a daily gain of less than half percent is a sign of weakness, not strength.

In today’s pre-market trading the S&P 500 futures moved to new highs, and gold miners showed gains in the London trading, but they are nothing to write home about – and more importantly, nothing that would change the bearish forecast for gold I described more broadly previously.

The bearish interpretation of the previous “strength” turned out to have been correct – the VanEck Vectors Gold Miners ETF (NYSE:GDX) declined yesterday.

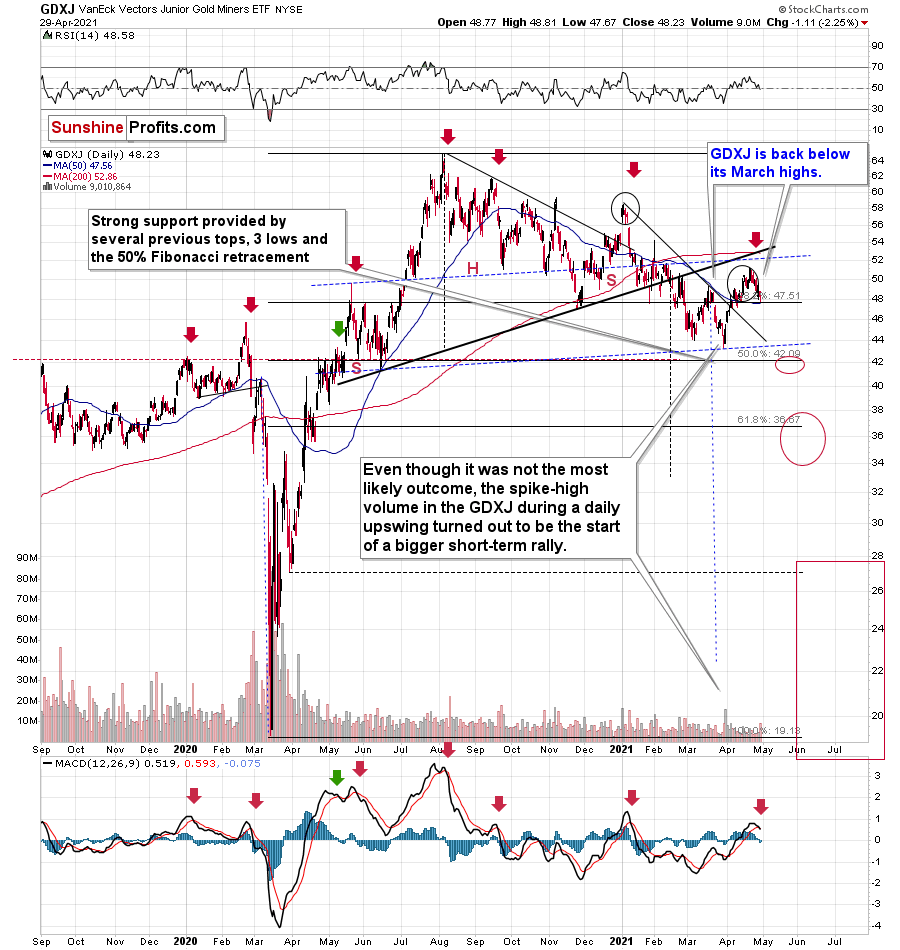
The decline was even more visible and important in the case of the VanEck Vectors Junior Gold Miners ETF (NYSE:GDXJ), where we have trading positions.
3rd party Ad. Not an offer or recommendation by Investing.com. See disclosure here or remove ads .

GDXJ Daily Chart.

This ETF for junior gold and silver miners (gold miners have much bigger weight in it, though) moved and closed back below its March 2021 highs.

Consequently, we have a situation in which:

  1. The USD Index is about to reverse and rally.
  2. Gold signals that it just can’t wait for the USD Index to rally, and it’s already declining (the pace at which it declines is likely to greatly increase once the USD Index takes off).
  3. Gold miners behave relatively normally, which in this case means that they are declining more than gold does (GLD (NYSE:GLD) just closed 1.14% below the highest daily close of April, while the GDX just closed 5.59% below the highest daily close of April). Besides, their recent move back to the May 2020 highs and the subsequent decline further increases the odds that the decline is going to shape the right shoulder of a huge head and shoulders formation with extremely bearish implications (once completed).
  4. GDXJ is underperforming GDX just as I’ve been expecting it to. While GDX declined by 5.59% so far (in terms of the closing prices), GDXJ declined by 5.67%. This might seem an unimportant level of underperformance, but the perspective changes once one realizes that GDXJ is more correlated with the general stock market than GDX is. Consequently, GDXJ should be showing strength here, and it isn’t. If stocks don’t decline, GDXJ is likely to underperform by just a bit, but when (not if) stocks slide, GDXJ is likely to plunge visibly more than GDX.
3rd party Ad. Not an offer or recommendation by Investing.com. See disclosure here or remove ads .

The above combination tells me that we are very well positioned in case of our short position in the GDXJ.

Besides, as an analytical cherry on the bearish GDXJ cake, please note that we just saw a sell signal from the MACD indicator (lower part of the chart) while it was visibly above 0, and after a relatively big short-term rally. We saw this kind of performance only several times in the previous year, and it meant declines in almost all cases. We saw it only once before this year – in early January, and a sizable decline followed.

Latest comments

I'm just doing a wellness check. to make sure you're okay. it's just money don't worry :-) and remember we need you here writing articles. you entertain us
You see? I told you! If you do the opposite of what he tells you to do, you'll be just fine!
Przemyslaw Radomski = Perma Bearomski = loseromski
For a demonstration of what cognitive bias can do to your ability to think clearly even when presented with evidence to the contrary of your desired outcome, review the comments.
definitely do not understand your post. question are we over $1,200 an ounce.
Wow, another gold perma-bear article from Sunshine.  Color me shocked...
you have been shorting precious metals since gold was at 1200... my biggest fear is that you'll disappear after this next loss to you occur again. please don't disappear after this next loss again. I will miss you
haha this guy deserves it.
I sold gold for the largest retail company and we knew the way gold works. Never forget that Gold is the only currency held in the major countries' safes. These countries are stockpiling gold for the coming reset among them. All the secret payments are one part of the story and when the Chinese and Russians make their next big move it will be to dump the dollar which is why they hoard gold. Gold will make its move when the Central banks worldwide need to make deals across Country borders. Meanwhile, stock up with what you can. Siver is a different story as it's tied to commercial uses and will surely go up with the need in tech etc.
Russia doesn't have enough dollars to affect the market.  Meanwhile China has 1 Trillion in US Treasuries, but if they sell them internationally they are exchanging them for dollars... which might not have the intended dumping effect on the currency that you envision... they could certainly cause a shock in bond markets.  But their priority is also maintaining a stable currency, pegged even, so I doubt that would be in their best interests... the same old doom and gloom story is losing it's edge... people should time their gold buys at a good value, or invest consistently perhaps.  I think Gold will hold $1720 after spending days in the chart.  Whether it will make it over $1850 is another question.
Interesting writeup, good to see some technicals that seem to have consistenly pointed a direction for you, thank you for sharing. I was going to mention the attractiveness of bond yields for large investors (and that will rally the dollar as well), I think they will be focused there for the next 3-6 months.  Banks and gold producers get to sell their gold and still keep it, hedging in a nutshell.  I see a lid on gold as well. For those who don't understand the DX / GC relationship - think of it just like a foreign currency.  When you buy gold you sell dollars - when you sell gold you buy dollars.   Gold producers and banks are selling their gold in the futures market and putting that money into bonds... if I had to guess.
You precious metal peeps are every bit as cult like as TSLA gang, WSB, or Crypto die hards. This analysis is sound. How many months of downward movement does it take for people to stop calling it a bull flag...? Massive QE, falling Dollar, historically low rates... Gold should be rocking... it's not. There's no crime in calling a spade a spade. (unless you bought spades at all time highs and now want your internet comments to move the market upward so you don't feel embarassed)
zloto podaza bond yields ostatnio:)
CFA institute may rescind your CFA certificate for wrong analysis. gold can move up or down for safe haven reason that is for no real reason
I remembered that when the price is $1690 several weeks ago, your analysis is gold on its bearish also. So I bought some ^^
the thing I do not like ot AT on large time frames is that AT uses the past to predict the future. In a stable world it could work. But now with QE at ludicrous speed in every continent, consumer spending about to explode as we exit the pandemic....there is nothing that we can learn from the past useful to understand the future. otherwise there is something useful but we must check the old financial history that is no more heavily studied in universities (I did but I know I am in a very little group)
why you wanna compare correlation yold and dollar. it's pretty broken gor a while sometimes dollsr fall gokd fall sometimes dollsr rise glld rise. paper gold manipulate phydical at the moment. you will see the real price pf gold soon
i disagree, gold is used in jewelry and weddings will resume (wedding ring), plus the jewelry retail market. Gold has likely 2 good years imo....
wow
Can you point out where in the formula for the DXY gold is accounted for? I can't seem to find it, because in reality DXY has nothing to do with price of gold. this is all supply and demand and hedge funds/banks setting/controlling the price of a highly traded commodity that has seen a decrease in inflows due to people wanting to throw their money into digital currency that doesn't even have currency status. I'm curious how you can write about gold without posting the M3 money supply anywhere in your article at a time like this though. or any mention of the FED's record reverse repo operation last Tuesday. or how gold just decided to stop following the bond market. you sir a propagandist.
Don't listen to him... he predicted $9 silver and $900 gold in April 2020 and he is still frustrated he missed it by 200% for silver and 100% for gold. Good advice: if he says price will go down: buy!
I'll point out this for you. The "Gold Prices and U.S. Dollar Correlation - 10 Year Chart" on macrotrends very clearly displays a correlation between gold and the dollar index price.
ok let's go back in 2008 and see if it works...
Risk Disclosure: Trading in financial instruments and/or cryptocurrencies involves high risks including the risk of losing some, or all, of your investment amount, and may not be suitable for all investors. Prices of cryptocurrencies are extremely volatile and may be affected by external factors such as financial, regulatory or political events. Trading on margin increases the financial risks.
Before deciding to trade in financial instrument or cryptocurrencies you should be fully informed of the risks and costs associated with trading the financial markets, carefully consider your investment objectives, level of experience, and risk appetite, and seek professional advice where needed.
Fusion Media would like to remind you that the data contained in this website is not necessarily real-time nor accurate. The data and prices on the website are not necessarily provided by any market or exchange, but may be provided by market makers, and so prices may not be accurate and may differ from the actual price at any given market, meaning prices are indicative and not appropriate for trading purposes. Fusion Media and any provider of the data contained in this website will not accept liability for any loss or damage as a result of your trading, or your reliance on the information contained within this website.
It is prohibited to use, store, reproduce, display, modify, transmit or distribute the data contained in this website without the explicit prior written permission of Fusion Media and/or the data provider. All intellectual property rights are reserved by the providers and/or the exchange providing the data contained in this website.
Fusion Media may be compensated by the advertisers that appear on the website, based on your interaction with the advertisements or advertisers.
© 2007-2024 - Fusion Media Limited. All Rights Reserved.