Get 40% Off
🚨 Volatile Markets? Find Hidden Gems for Serious Outperformance
Find Stocks Now

Gold: $1600 Bottom Likely To Be Transient

Published 03/05/2021, 05:11 AM
Updated 09/02/2020, 02:05 AM

The first thing you need to do is forget the impact the February US jobs report will have on the gold price beyond today. Forget it, because the impact will most likely be what Federal Reserve Chairman Jerome Powell calls “transient”.

I say that because that’s the phrase Powell used to express his nonchalance about rising price pressures in an economy still impaired by COVID-19.

The Fed chief told a jobs event hosted by the Wall Street Journal on Thursday that there was “a difference between a one-time surge in prices and ongoing inflation", before adding that “a transient increase in inflation will not affect inflation over a longer period”.

Powell’s opinion about near-term inflation—and conviction that America will not return to maximum employment this year or soon—sent US bond yields, measured by the benchmark 10-year Treasury note, ripping higher, along with the dollar.

Share prices on Wall Street, meanwhile, cascaded as investors worried about overvaluation in high-flying tech stocks such as Apple (NASDAQ:AAPL), Microsoft (NASDAQ:MSFT) and Amazon (NASDAQ:AMZN).

Gold, already on a slow-burn meltdown over the past two weeks, got swept up in the equity market rout despite its so-called standing as an inflation hedge. The imminent Senate passage expected for President Joseph Biden’s $1.9 trillion coronavirus relief bill, which should hand the US a larger budget deficit and higher debt-to-GDP ratio—both good for gold—were ignored.

All these happened because Powell ruled out that the US central bank, under his guidance, will immediately step up bond buying to tame spiking yields. This was because of his belief that any inflationary pressure that the United States experiences this year will be transient, which should technically benefit gold. The term has become one of the Fed chief’s favorites in the pandemic era, with him using it three times in the past month alone to say he won’t be pressured into acting by temporary economic forces.

3rd party Ad. Not an offer or recommendation by Investing.com. See disclosure here or remove ads .

Jobs Number Will Also Be Transient For Gold

Using the same logic, I implore you to look beyond the February jobs number that will be released today if you wish to hazard a direction—or more importantly, bottom—for gold in the $1,600 an ounce territory. It will be, as Powell might describe, transient in the grander scheme of an economy still struggling to get back to optimal employment, and there are many other moving parts that will decide the outlook for risk assets and safe-havens (if gold can still be called that, something I doubted a month back).

Ostensibly, the higher the jobs growth in February, the weaker the allure for gold; and vice-versa. Yet, don’t forget that jobs are the hardest things to develop in an economy and often the last to come roaring back after a prolonged devastation. For what it’s worth, there were 227,000 jobs lost in December before an expansion of 49,000 in January. So, until they get steady, they may not necessarily be the best marker for gold.

Since there are really no credible fundamentals to hang a gold outlook on to, what is the forecast from a technical point, at least?

There are various “pain” and “relief” points for the yellow metal that multiple seers, including me, have (I’ll save mine for last).

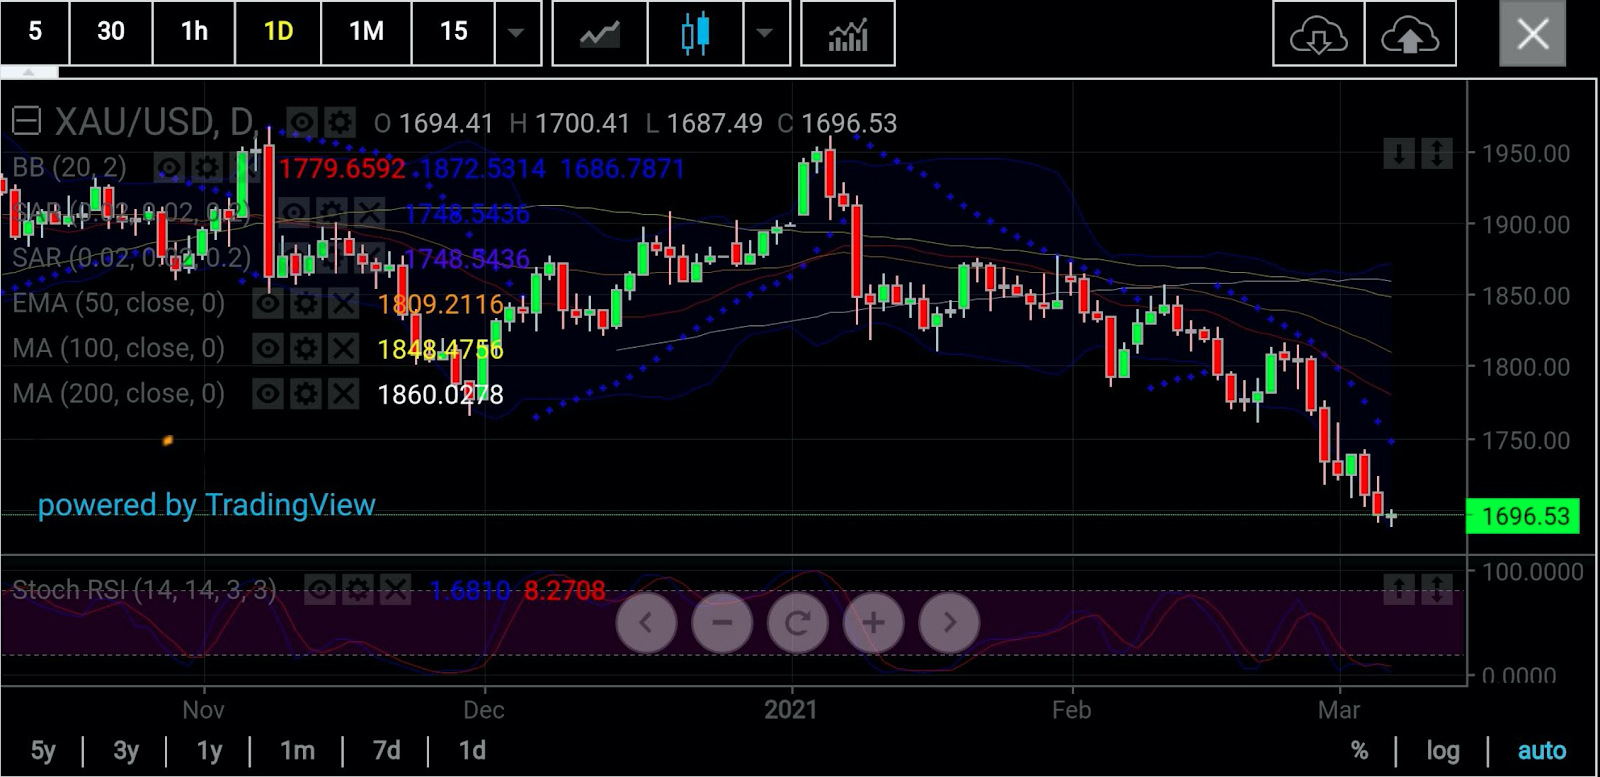
Let’s start with Sunil Kumar Dixit of SK Dixit Charting in Kolkata, India. He sees the spot price of gold, which hedge funds rely on more than futures for gold’s direction, snapping back to $1,843 at its best and cratering to $1,460 at its worst.
3rd party Ad. Not an offer or recommendation by Investing.com. See disclosure here or remove ads .

Gold Daily

All charts courtesy of SK Dixit Charting

'Gold On Its Knees … Quivering'

In Dixit’s words, “gold has gone weak on its knees and is quivering”. He adds:

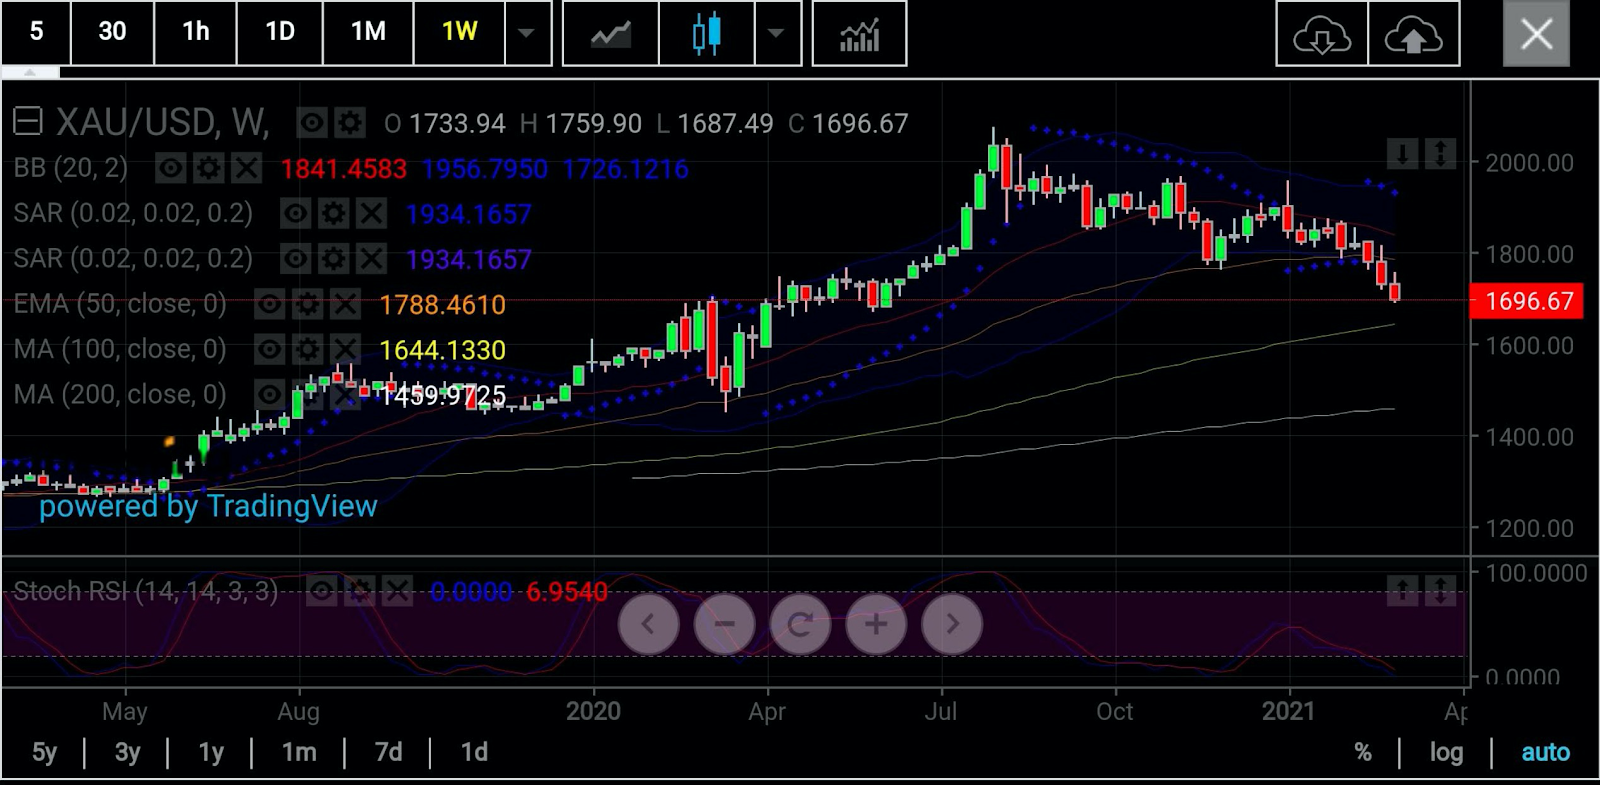
“We are not at the bottom yet. The only reliable technical support is the 100-day Simple Moving Average on weekly charts which reads $1,646. This support has enough potential to send gold back up by at least $100 or $150, if not $200.”

“The bounce back from this critical support of $1,646 can help gold retest the 50-week Exponential Moving Average at $1790 and even 20-week Simple Moving Average at $1,843.”
Gold Weekly

But only a decisive weekly close above $1,868 can signal a reliable reversal and a major bottom for gold, Dixit said.

Otherwise, graver risks await, first for bulls and later bears, he added, explaining:

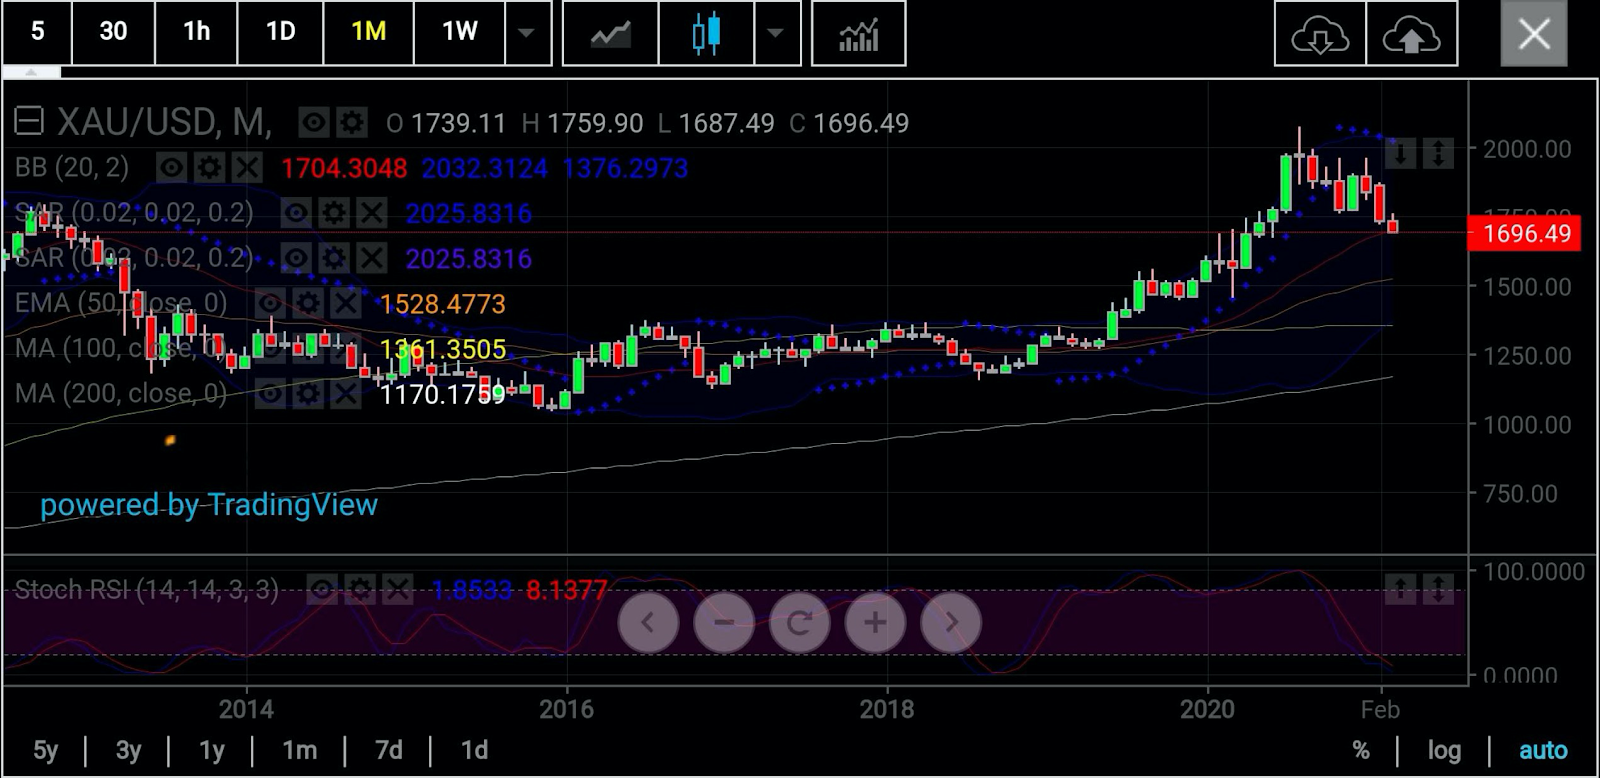
“Going by the prevailing and all-pervasive weakness in gold, the bearish streak can expose it to the 50-month Exponential Moving Average of $1,530 before the metal hits the 200 Week Simple Moving Average of $1,460. If this does happen, it will be a double bottom. This potential double bottom will result in explosive reversal to ignite the next bull rally for alarming heights.”
Gold Monthly

Notwithstanding any rebound from such levels, one thing must be remembered—a drop to $1,460 will almost completely wipe out all of gold’s gains which came on the back of COVID-19 fears. In March 2020, spot gold bottomed at $1,451.50 just before it began an epic 4-½ month rally that added nearly $600 to its price, hitting an all-time high of $2,073.41 in August.

3rd party Ad. Not an offer or recommendation by Investing.com. See disclosure here or remove ads .

Dhwani Mehta, in a blog posting on FXStreet, argues gold is testing the lower band of a potential falling wedge, with key support placed at $1,687.

In her notes, she says:

“A four-hour candlestick closing below the latter is needed to confirm the downside break, paving way for a drop towards the June 2020 low of $1,671.”

Jeffrey Halley, senior strategist for Asia Pacific at OANDA, notes that gold is precariously perched above its 61.80% Fibonacci support at $1,689 an ounce.

“A weekly close below that level this evening will be a significant bearish technical signal. It will set gold up for deeper losses to the $1,600 an ounce region over next week.”

An IG “client Sentiment summary” issued on Thursday meanwhile showed traders were net-long gold at a +5.85 ratio (85.41% traders long)—which, typically, is a bearish reading.

The IG note adds:

“We typically take a contrarian view to crowd sentiment, and the fact traders are net-long suggests gold prices may continue to fall. Traders are further net-long than yesterday and last week, and the combination of current positioning and recent changes gives us a stronger gold-bearish contrarian trading bias from a sentiment standpoint.”

'Strong Sell' Recommended By Investing.com

On my end, not surprisingly, Investing.com’s Daily Technical Outlook has a “Strong Sell” on COMEX gold futures’ front-month April contract.

Should the contract extend its bearish streak, then a three-tier Fibonacci support is forecast, first at $1,690.31, then $1,682.89 and later at $1,669.30.

In the event of a rebound, then a three-stage Fibonacci resistance is expected to form, first at $1,716.29, then $1,724.31 and later at $1,737.30.

3rd party Ad. Not an offer or recommendation by Investing.com. See disclosure here or remove ads .

In any case, the pivot point between the two is $1,703.30.

As with all technical projections, we urge you to follow the calls but temper them with fundamentals—and moderation—whenever possible.

Disclaimer: Barani Krishnan uses a range of views outside his own to bring diversity to his analysis of any market. As an analyst for Investing.com he presents divergent views and market variables. He does not hold a position in the commodities and securities he writes about.

Latest comments

Excellent. Useful. Thanks. (likely: firstly gold reacted(s) to yields (as seen), when those calms and some inflation returns (not seen yet), gold can/will start uptrend again (or range again).
Gold tends to be a forward indicator for bonds and equities. Bonds have taken a beating. Now it’s time for equities
Monthly chart showing a cup and handle. Long term gold looks great
“1843 to 1460”... and this guy you quoted is a gold expert? And the other expert is mixing EMAs with SMAs. Both analyses are useless. Lets talk about more substantial TA rhats actually helpful. Look at the 1W or 1M RSI which both show more downside near term.
Chart Harmonics. Broader analysis connotes broader range... nothing new. Using a combination of EMA and SMAs is a widely practiced tool in TA. Weekly and Monthly charts hint at further weakness and this is reflected in the RSI which has been used in a dynamic theme of Stochastic RSI. Cyclical moves often bring pull back reactions too, hence the upper resistance cluster cited.You may be having some good analysis too. Post your work that would be appreciated and would be of great value for the readers. Blind criticism of someone's work hardly helps anyone. Looking forward to your useful TA.
should we sell or buy gold to USD when market opens sir?
I like your style.the way you explain..what about silver..
Thanks much, Bharat. Will probably issue a silver piece in the coming week.
Gold is heading to all time highs this summer
Let's see, Chad Bull. For now at least, the path of least resistance seems lower.
2009?.. Less printing same TNX?
Thank you explaining the Gold behavior and sharing experts comments. It is very insightful. I would like to read your analysis on silver and platinum
Thanks much, Sarita. We will probably be explaining other precious metals in the coming week.
I think today,s clossing above $1701 ll add positive sebtiments minimum to $1710 and then then it ll consolidate but and then $1730
Sony, close today will be important. If it gets above $1,700 at least, then it has chance of a slow build back.
IMHO 1710 wont cut it- I need a weekly closed bullish candle to go long again - doji at minimum- thats about a 1730 close and it wont happen today - but I prefer a bullish hammer or engulfing green candle - i think we are headed to 1650- thats a solid base from laat years rally
Robert Flores you made a good point... Until gold shows a resolve with a day closing above 1710-1730 cluster, further weakness is a possibility.
best analyst in i.com. Thanks a lot Barani. In gold we trust!
Thanks much, Enron. A lot of my other colleagues do great work as well, including independent third-party contributors like Sunil Kumar Dixit. Truly appreciate your vote of confidence. Keep reading us and following us on Twitter @Investingcom . Bests.
Paper gold price could go to zero.. Market makers could do that.. But those who own the physical metal aren't bothered in the slightest.. Paper prices are falling at twice the rate of bullion, if not more.
Very true.
I'll second that. Cleve. All reports indicate that it's truly hard to find physical material. That will tell you the respect gold commands in the real world.
questions, are central banks buying bullion at record levels like they were in years past?Hows the mining supply? Do they have shortages like silver?
Robert Flores. Buying from Central Banks reflects in swift price jumps more often than not. In fact the central banks and hedge funds are hands in gloves in pushing gold down to their comfort zone.
yes! and there is no authority or regulatory body that can do anything about it! The clinton deregulation of markets worsened the market manipulation problem across the board
The 'Too big to fall' wall street banksters and a coterie of shark hedge funds are doing everything they want to do to suppress Gold for their own greed.
The gold 7 month pull back looks very similar to the 2008 one- so will gold take off only after the stock market hits bottom again and slow but consistent recovery is apparerent?
this really describe whats in my mind , us market is recovering , president calmed everone by expecting ZERO corona by may .. i think us market and dollar are getting stronger than before .. and yes gold is diving .. even maybe lower than 1450
Vip Homi. Gold has a lot of action to do before bears or manipulators succeed in pushing it below 1600. Sub 1450 is highly unlikely though.
Sure I keep buy gold and hold for long term target 2,500$
Look at a five-year chart $1500
Bought $1555 Futures Contacts Yesterday! Making good money
First they didn't expect inflation. Then it was only going to be muted. Then it was going to exist, but won't be THAT bad. Now it's going to be high but not for long. Next it will be "noone could have see stagflation coming."
Thanks Peteymcletey, I've replied to another comment of yours below.
Thanks for the article Barani. I don't get why people are so surprised/upset with this move in gold. I mean, that's the game of investing, if people are scared about pullbacks and fluctuations, I mean, they should just stay in cash and sink with it in the long run.
Hello Falec, I guess people are more passionate about some assets versus others. It"s truly a no-no in investing to get emotionally involved with any market and, yet, you see it happening all the time with some people. Call it "conviction" , if you like. I don't trade as you know. But when something is forced to defy its natural behavior -- i.e. gold as an inflation hedge and safe haven -- it can be troubling to me. Hence, my "defense" at times, if you will, of gold.
I do not believe you have ever owned any Gold but simply write about it.
Yes, I "own" gold ... if you're referring to wedding band on finger and heritage chain on my neck. When something is forced to defy its natural behavior -- i.e. gold as an inflation hedge and safe haven -- it can be troubling to me. Hence, my "defense" at times, if you will, of gold. Call it "conviction" if you like.
Peter Neal. You are no way someone to judge whether the author holds any gold or not. Talk something that adds value to the discussion or keep the gap closed.
 Right
Second thing you need to do is to forget about economy science and any other economic facts happened through history. Hahaha what a funny wash of brains you practice in this article dear writer!. NFP report today will be negative, this will prove that the economy of us is going in very deep stagnation, now the system job becomes to hide this from people, and manipulate the market as possible. Through the history of financial fallouts the system felt down as people discovered the truth. I’m no longer commenting on any of your articles, as I recognized that you are a part of the biggest fraud and manipulation in man’s history.
These things built on facts, facts lead to logic, when you define sun, you understand that it has different characteristics than moon. What changes?; has a new rare metal been discovered in the world?, or will people change the logic they have developed since the beginning of their existence?.
 Try thinking that people's money -- sometimes livelihood -- depends on the market decisions that they make. A responsible market analyst alerts readers to changes in the marketplace that's present and likely to come. Trying to equate the invariability of the sun or moon to a metal that has been turned into a financially tradable commodity is simply disingenuous.
Gold is a fact in the economic theory proved to be the ultimate safe-haven, technological products burst through history. You have two facts here, the logic is that you can’t make one of them the other :).
thank you, great article. I'm definitely surprised gold is this low with the 1.9t looming, but I'm also surprised anyone would want the dollar even after Powell's speach. a Gold backed crypto will be the lynchpin that sends gold to all time highs for good and send all the rest of the cryptos to 0 until they are backed by something of value in my opinion.
Fed printing press running molten atm. I think gold got way ahead of itself already. So it's a hard one to peg what's reasonable right now.
 You're absolutely right here, and as well on the so-called inflation read. Wall Street, seems to have to come up with a Mary Poppins-styled "Supercalifragilisticexpialidocious!" definition of inflation suited to debunk everything we've learned of finance over the past four decades. There aren't enough facepalms to put up here for sure.
I take a peak at shadowstats (wish they picked a better name) every so often. it's like every time inflation looks bad, they change how we measure it.
Risk Disclosure: Trading in financial instruments and/or cryptocurrencies involves high risks including the risk of losing some, or all, of your investment amount, and may not be suitable for all investors. Prices of cryptocurrencies are extremely volatile and may be affected by external factors such as financial, regulatory or political events. Trading on margin increases the financial risks.
Before deciding to trade in financial instrument or cryptocurrencies you should be fully informed of the risks and costs associated with trading the financial markets, carefully consider your investment objectives, level of experience, and risk appetite, and seek professional advice where needed.
Fusion Media would like to remind you that the data contained in this website is not necessarily real-time nor accurate. The data and prices on the website are not necessarily provided by any market or exchange, but may be provided by market makers, and so prices may not be accurate and may differ from the actual price at any given market, meaning prices are indicative and not appropriate for trading purposes. Fusion Media and any provider of the data contained in this website will not accept liability for any loss or damage as a result of your trading, or your reliance on the information contained within this website.
It is prohibited to use, store, reproduce, display, modify, transmit or distribute the data contained in this website without the explicit prior written permission of Fusion Media and/or the data provider. All intellectual property rights are reserved by the providers and/or the exchange providing the data contained in this website.
Fusion Media may be compensated by the advertisers that appear on the website, based on your interaction with the advertisements or advertisers.
© 2007-2024 - Fusion Media Limited. All Rights Reserved.