After featuring XAU/AUD (the ugly cousin?), over the last couple of weeks, a double top in XAU/USD has eventually brought us back home!
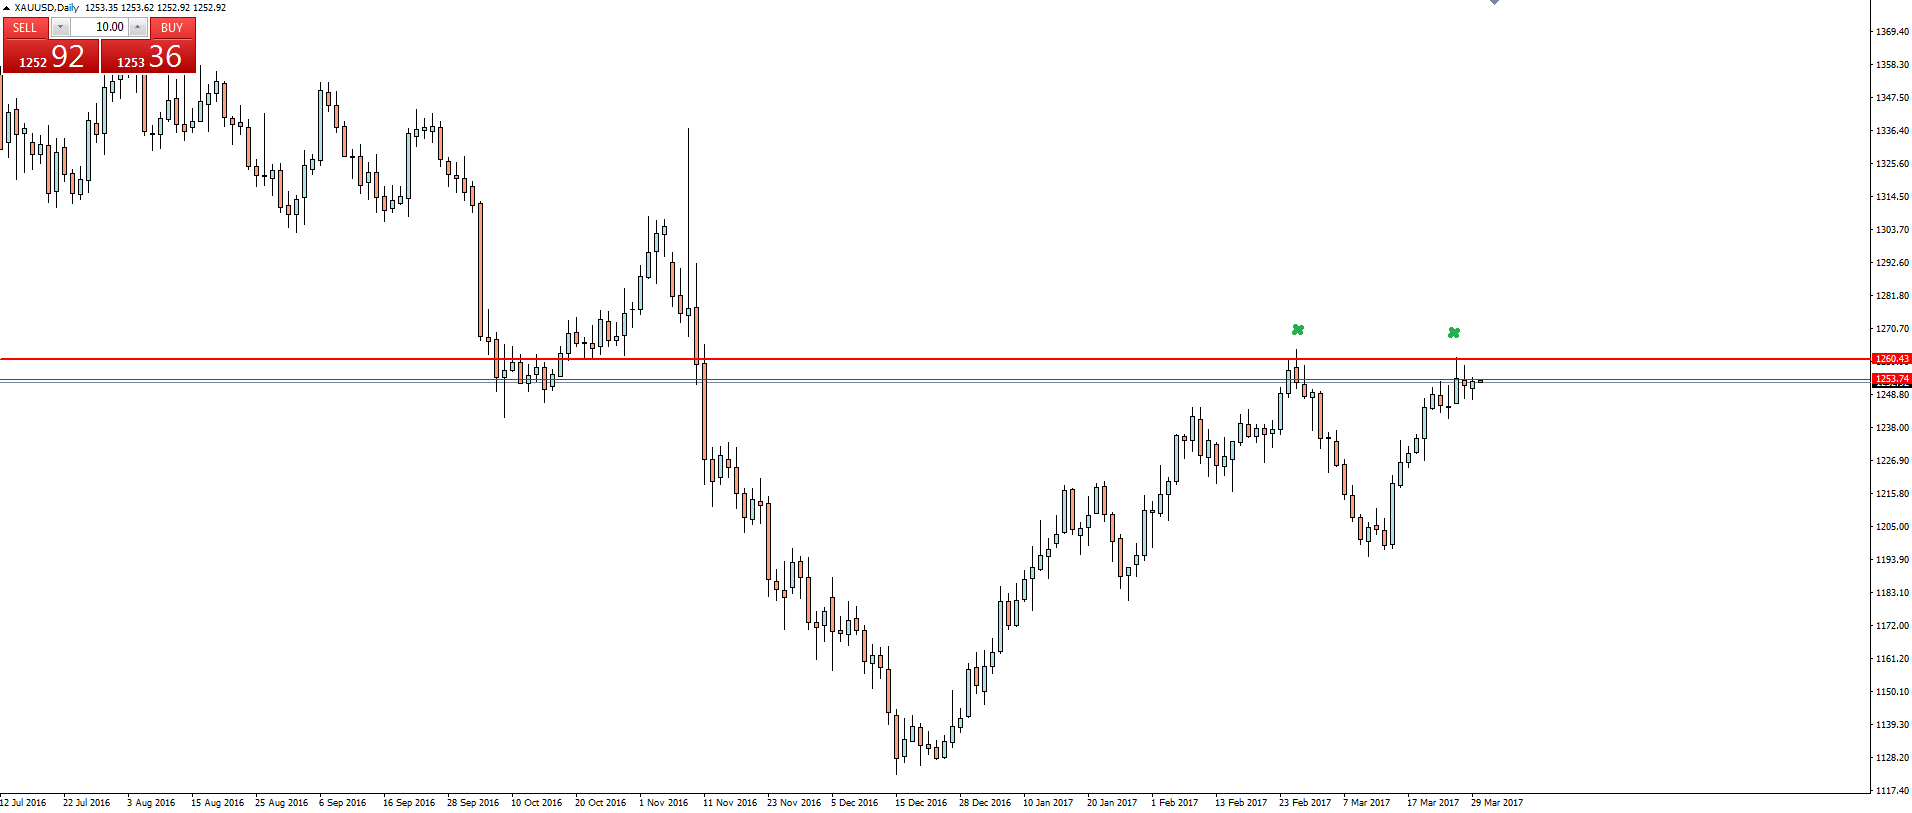
First up we focus on the gold daily chart, featuring a nice double top at previous support turned possible resistance:
A double top that just happens to coincide with that previous swing low you can see on your MT4 charts from back in September 2016.
I guess you could call that a confluence of resistance now that we have the second touch of a potential double top? Well, whichever way you want to look at it, you have price that has retested previous support as resistance on the daily and when you zoom in that little further you can see potential for a clear double top.
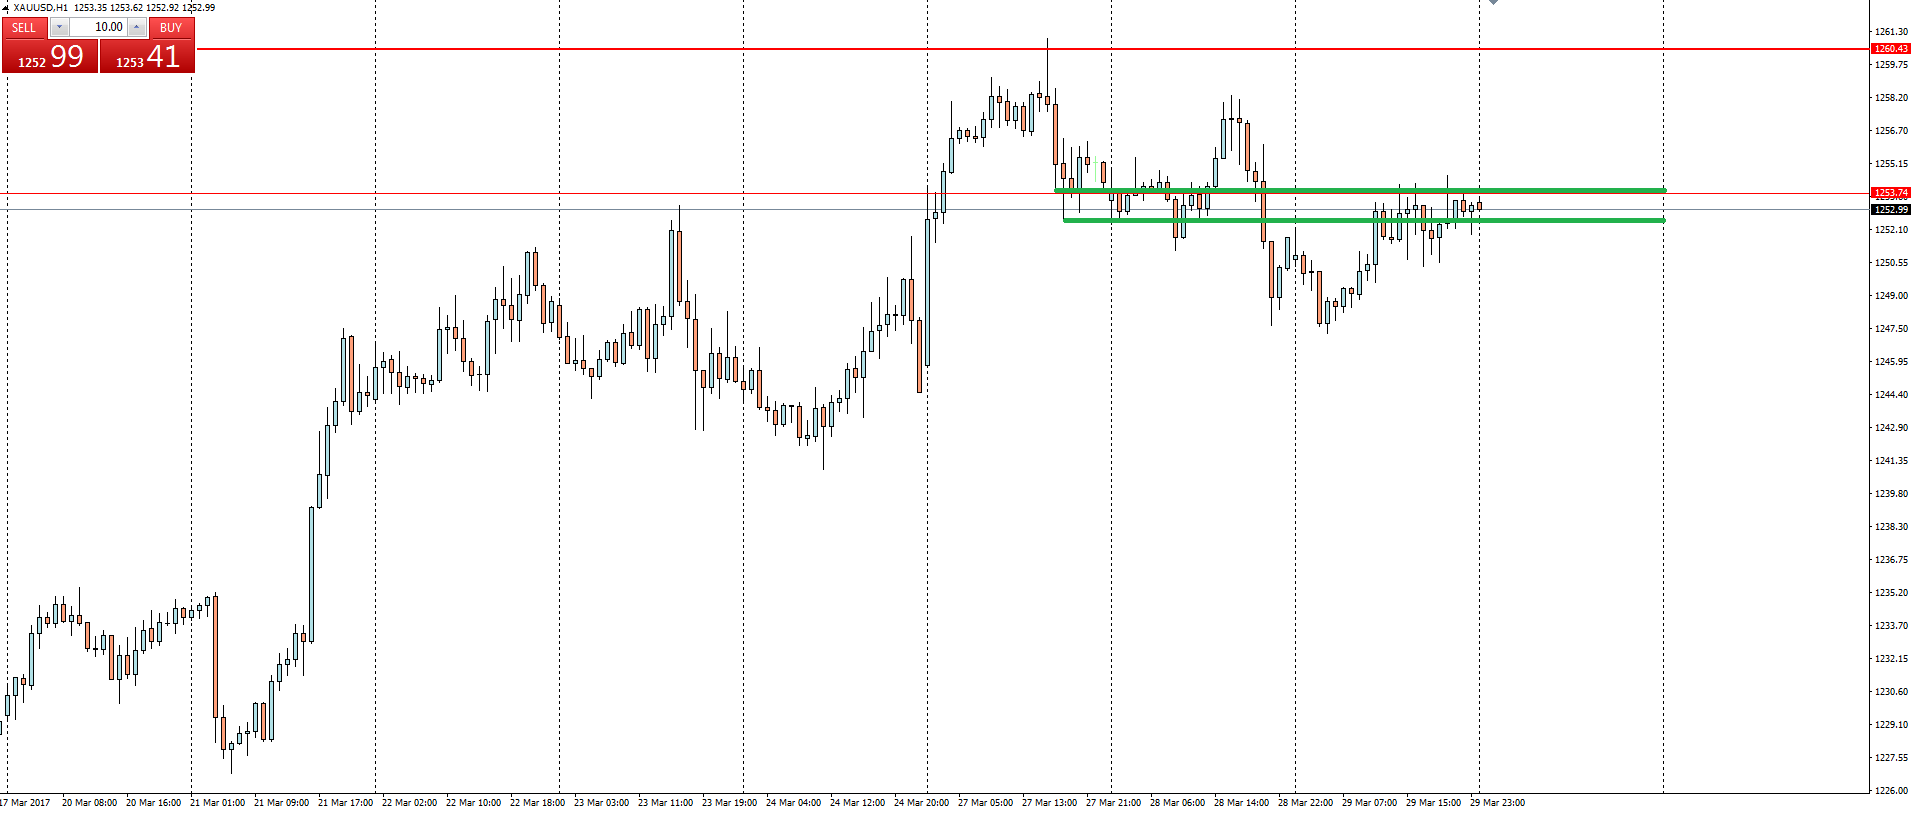
So now that price is being capped by resistance, we zoom into an intraday chart to look for possible short term pullbacks to short into:
Price hasn’t cleanly rejected off the daily level like we’d ideally like, but if you’re after textbook idealism then live forex trading probably isn’t for you.
In saying that, price is forming lower highs and lower lows and this level is a short term retest that we can use to enter off and manage risk around if you’re aggressive, while still being close to enough to the double top if you’re more conservative.
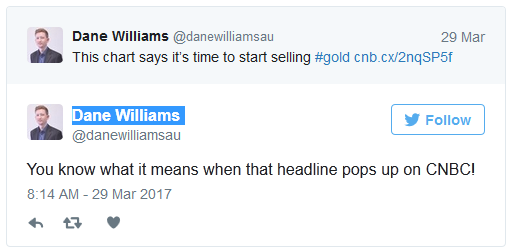
Before I wrap up this morning’s post, I want to embed a Tweet I shared yesterday:

It was a tongue in cheek comment about how being a contrarian to trading calls made in the mainstream media is never a bad strategy.
My chart is obviously a little different to the gold chart in that CNBC article, but the possible herd mentality of this trade is definitely something to be aware of.
Risk Disclosure: In addition to the website disclaimer below, the material on this page prepared by Vantage FX Pty Ltd does not contain a record of our prices or solicitation to trade. All opinions, forex news, research, tools, prices or other information is provided as general market commentary and marketing communication – not as investment advice. Consequently, any person acting on it does so entirely at their own risk. The expert writers express their personal opinions and will not assume any responsibility whatsoever for the Forex account of the reader. We always aim for maximum accuracy and timeliness, and FX/commodities broker Vantage FX shall not be liable for any loss or damage, consequential or otherwise, which may arise from the use or reliance on this service and its content, inaccurate information or typos. No representation is being made that any results discussed within the report will be achieved, and past performance is not indicative of future performance.


