Oracle stock jumps 5% on TikTok deal progress, OpenAI fundraise talks
The risk budgets this month are unchanged. For the moderate risk investor, the allocation between risk assets and bonds remains at 40/60 versus the benchmark of 60/40. While the BofA ML High Yield Master II OAS did widen significantly since the last update I’ve decided not to reduce the risk allocation more at this time. The stock market selloff and bond market rally has already changed our allocation somewhat and I would not rebalance at this time.
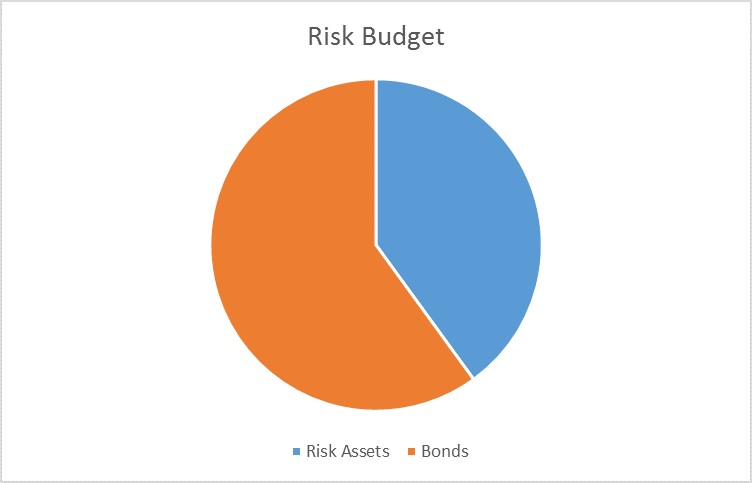
A further reduction in equity exposure at this point is tantamount to predicting a recession and while there is plenty of reason for concern, I don’t think we can make that call just yet. The odds have risen but they aren’t 100%. With more at stake on the bond side, at this point our bigger risk is that we don’t have a recession and adding to bonds at this point could actually be increasing risk. I am making some changes to the bond side for exactly that reason, reducing duration after the big rally on the long end. If we get some kind of countertrend rally in stocks and we have reason to believe recession is more likely, we may yet move the risk allocation lower. But for now, I think our current allocation is adequate protection.
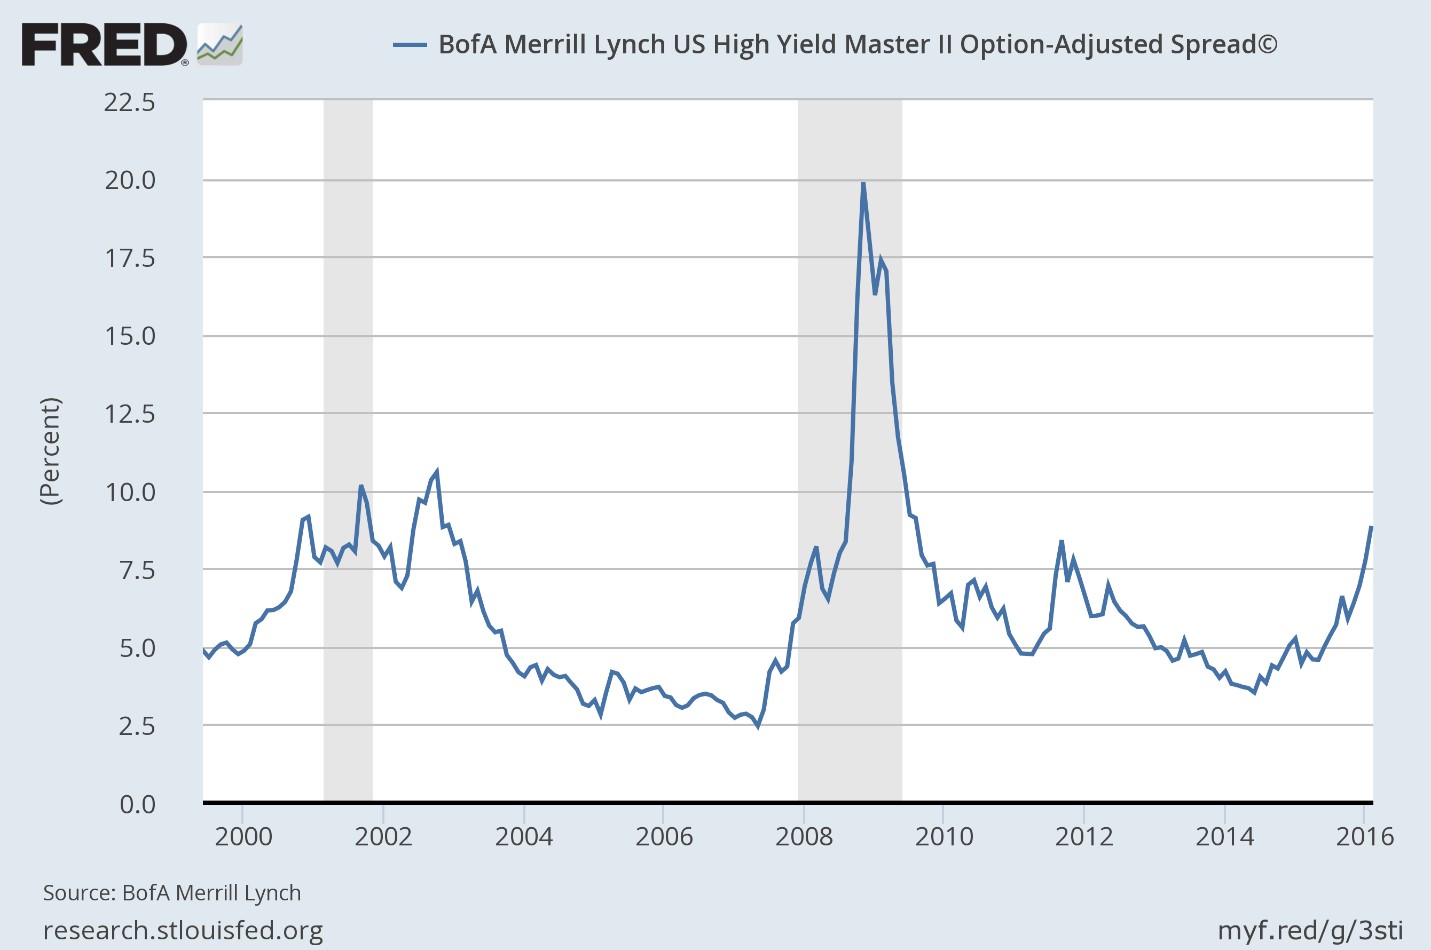
- High yield credit spreads continued to widen since the last update, moving from 7.24% to the current 8.87%, a level only recently exceeded during the Euro crisis in 2011. CCC bonds are now trading with a spread over 20%, comparable to the level that preceded the 2001 recession. Spreads have widened across all credit levels including AAA which has widened with Exxon (N:XOM), one of only 3 AAA companies left (O:MSFT, XOM and N:JNJ), now on negative credit watch by S&P.
- Valuation are still excessive and 4th quarter earnings look to come in negative year over year but about 4-5%. That will be three consecutive quarters of year over year decline, something not seen since 2009.
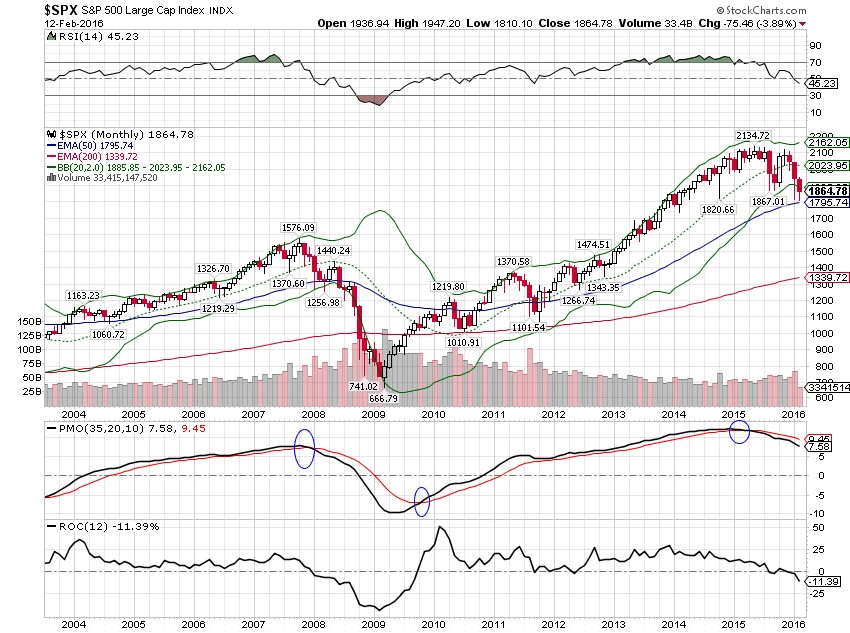
- Long term momentum is still negative and has quite a long way to go before we can even think about a turn. Short and intermediate indicators are negative as well, although short term is oversold.
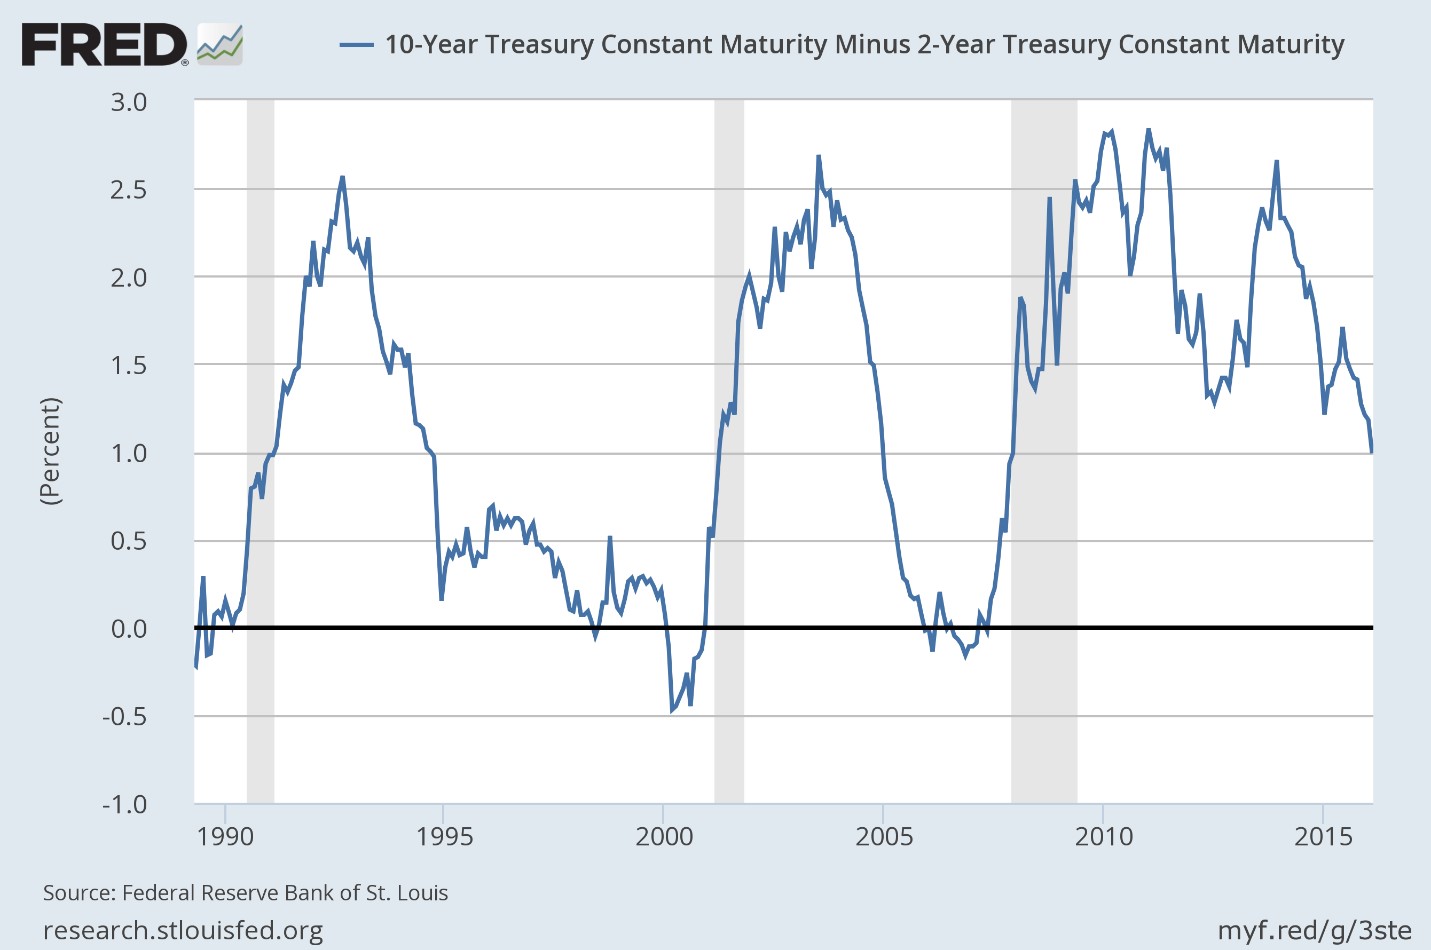
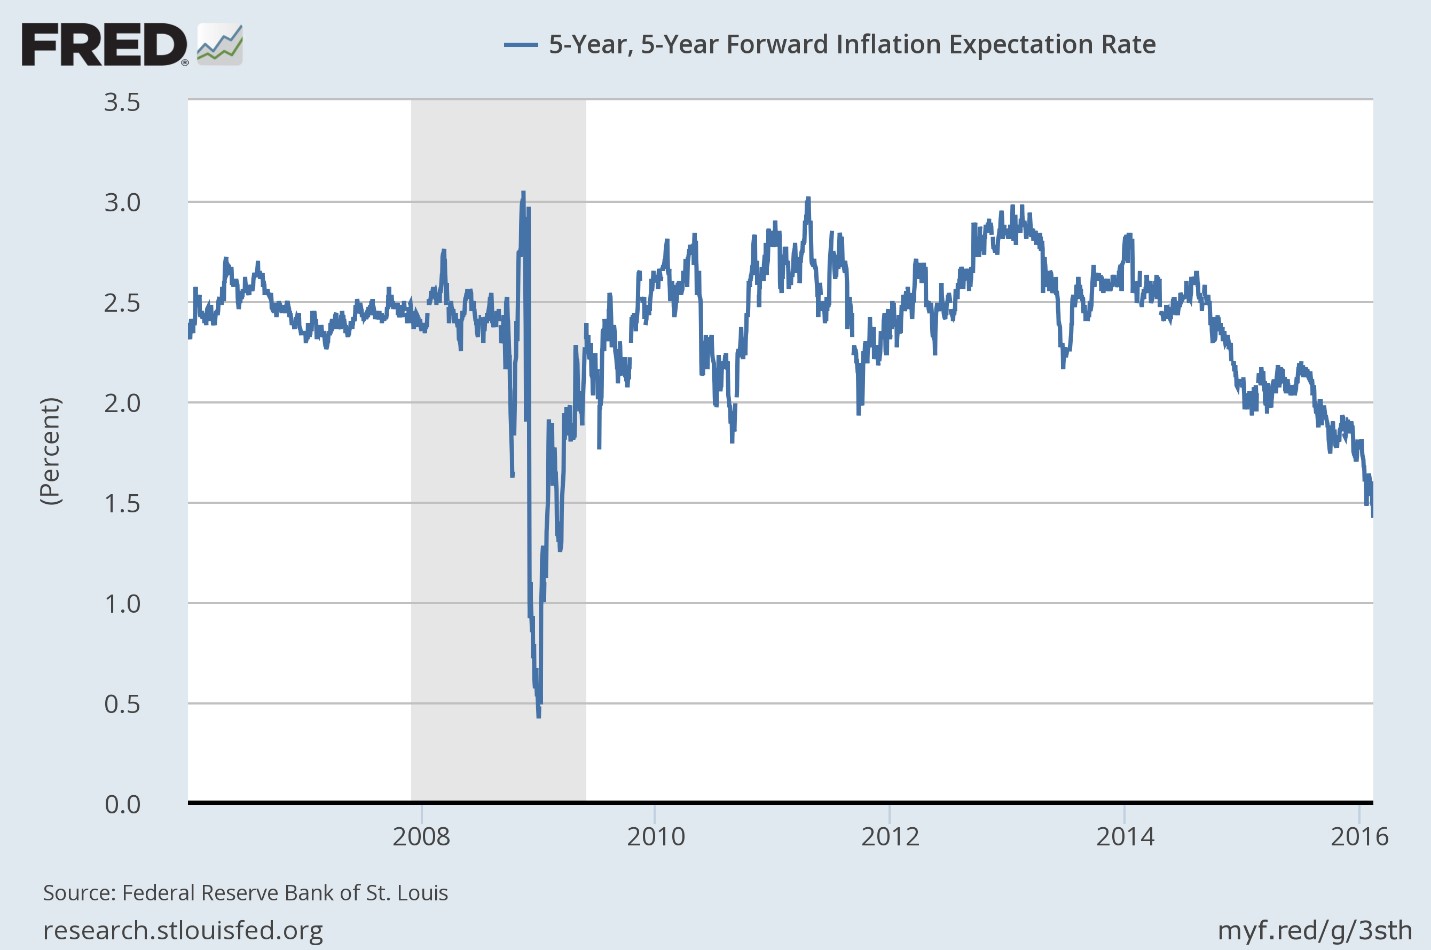
- The yield curve has continued to flatten, now the flattest for this cycle. Real interest rates have fallen since the beginning of the year which has pulled the dollar down and pushed gold higher. Inflation expectations also continue to fall.
Credit Spreads
Credit spread widening has accelerate in the last month and has a whiff of panic about it now. The junkiest bonds are now trading with spreads over 20% but even highly rated bond spreads are moving wider. It seems that part of that is a desire by some to get ahead of what they see as a potential liquidity squeeze at the banks and brokers. The fear of negative interest rates is affecting markets today even though that would seem to be something quite a ways away in the US. New issuance in the corporate space has slowed significantly lately with exactly zero issuance last week, the first time that has happened in a non-holiday week since at least 1995. That could be reluctance by corporations to issue with spreads where they are or it could be that we’re having a buyers strike. Either way activity is greatly reduced.
Credit spreads are one of the most negative signs we have in markets and indicate a greatly reduced appetite for risk.
Yield Curves/Bonds
The yield curve continued to flatten, inflation expectations and real interest rates fell. All of these are indications of reduced growth expectations, nominal or real. The yield curve is not flat yet but it may not get there prior to the next recession. Japan has seen several recessions start since they went to ZIRP without an inversion. All we can say really is that the flattening curve means we are getting closer to the end of the cycle.
Real interest rates have fallen since the beginning of the year pulling the dollar down and pushing gold higher. Falling real rates are an indication of reduced real growth expectations, something we’ve been expecting for some time. The performance of our TIPS allocation in our more conservative accounts improved significantly over the last month.
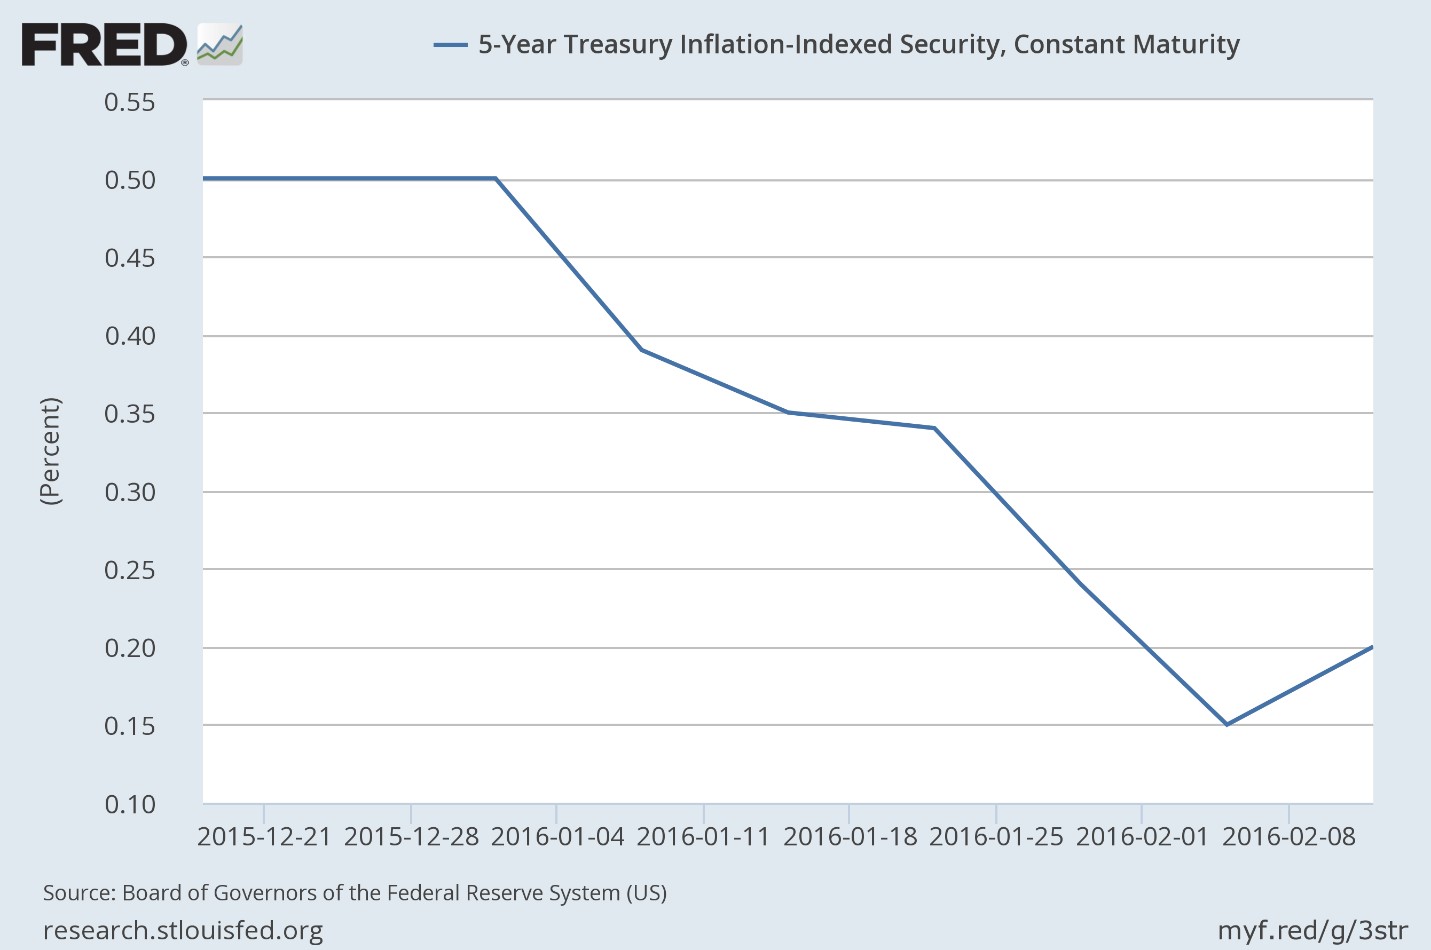
Inflation expectations continue to fall, driving down nominal yields as well. The Fed can think what it wants but the movement of real rates and market based inflation expectations would seem to indicate that policy has been and remains tighter than the Fed knows.
Valuations
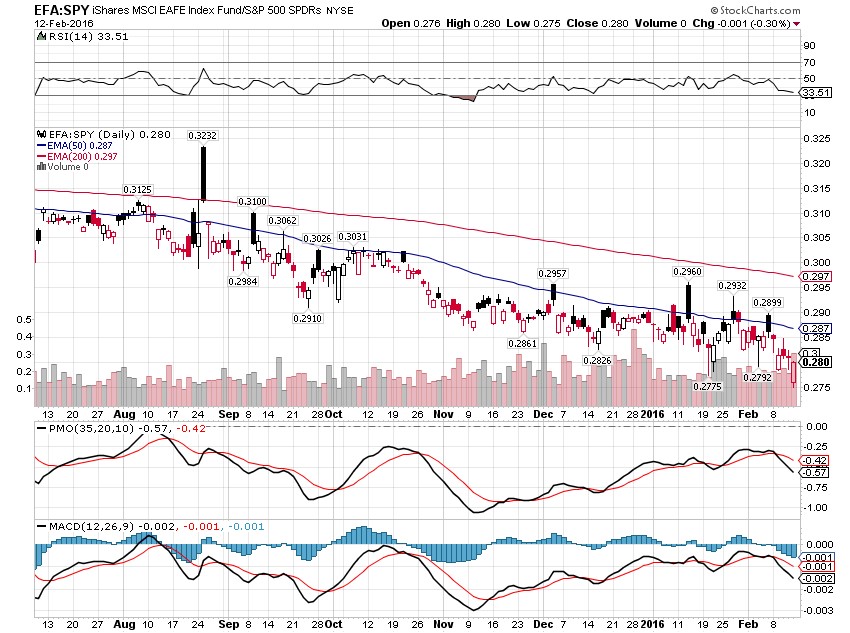
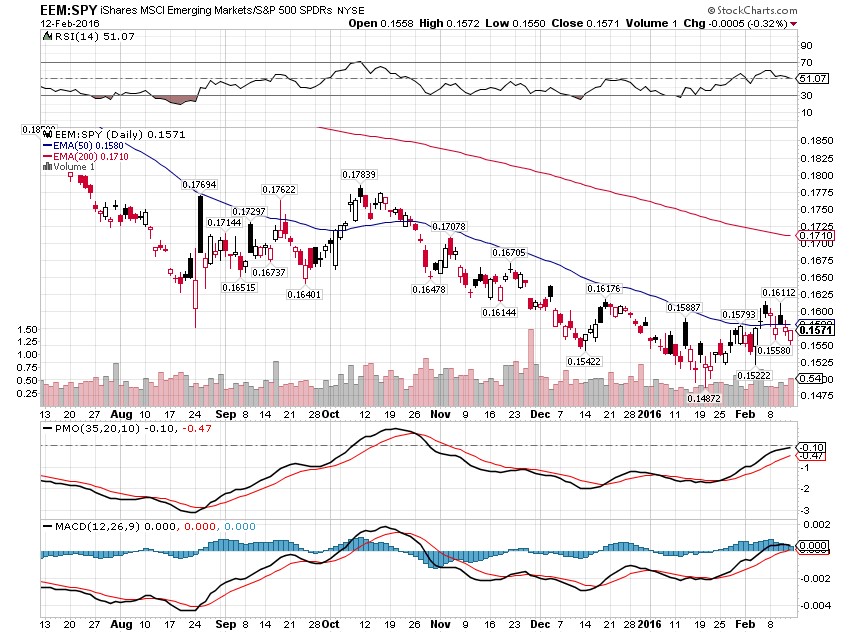
US stock market valuations remain elevated while foreign markets are cheaper but performing worse. EAFE has underperformed since the beginning of the year and even with the dollar pulling back, that shows no sign of changing. It is interesting that EM stocks have outperformed the S&P since the middle of January. Theoretically, a weaker dollar should be good news for EM economies and markets. But any strengthening of EM currencies at this point is very speculative and tentative. I am not willing to make a bet on it just yet.
Momentum
The trend for stocks is down and momentum accelerated in that direction over the last month. Momentum continued to shift to Treasuries and gold as I’ve outlined over the last few of these updates. The trends may be a bit extended in the very short term but I think they are well established now and probably quite early in the big picture. It is my aim to reinforce those trends with our asset allocation at opportune times throughout the year. We have not yet seen a shift of momentum to general commodities, something I do expect in the first half of this year.
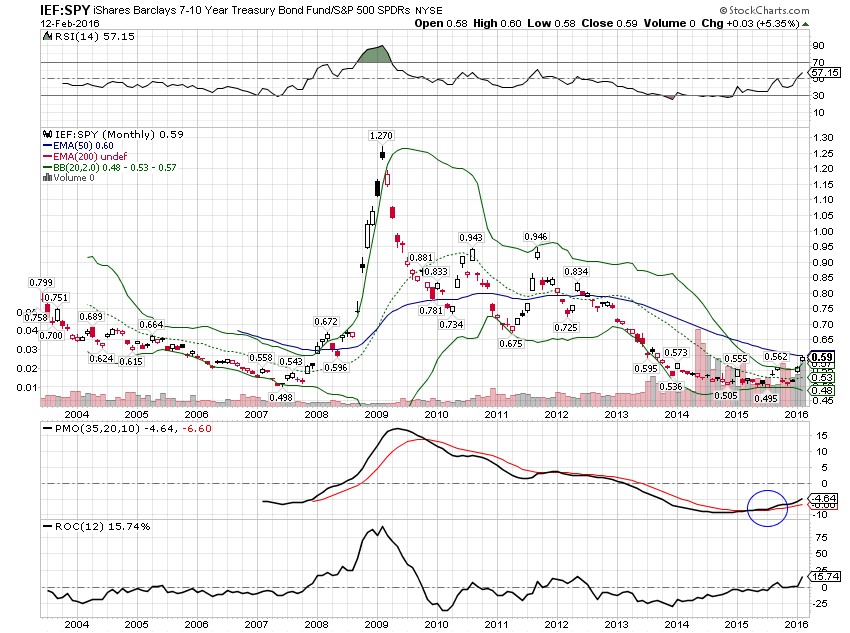
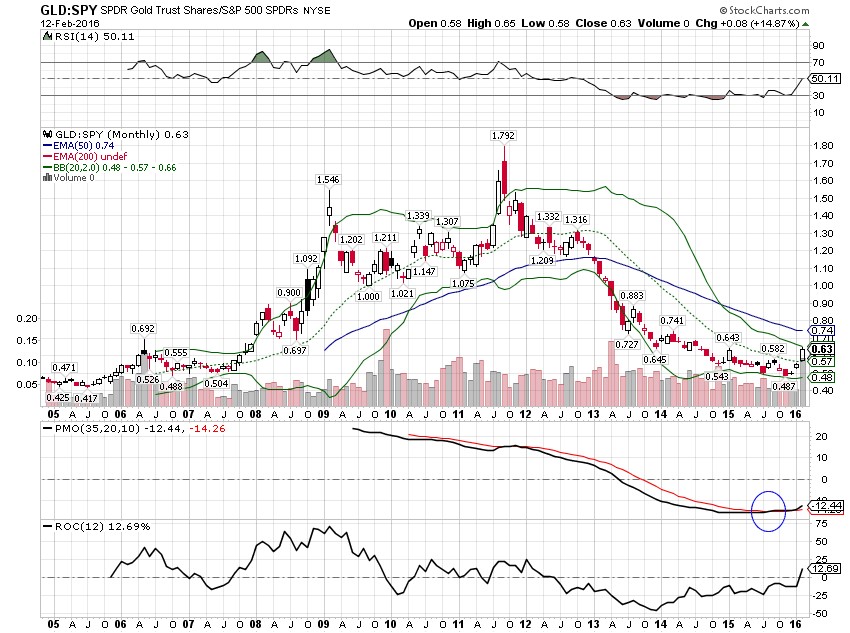
Other Relative Performance Charts
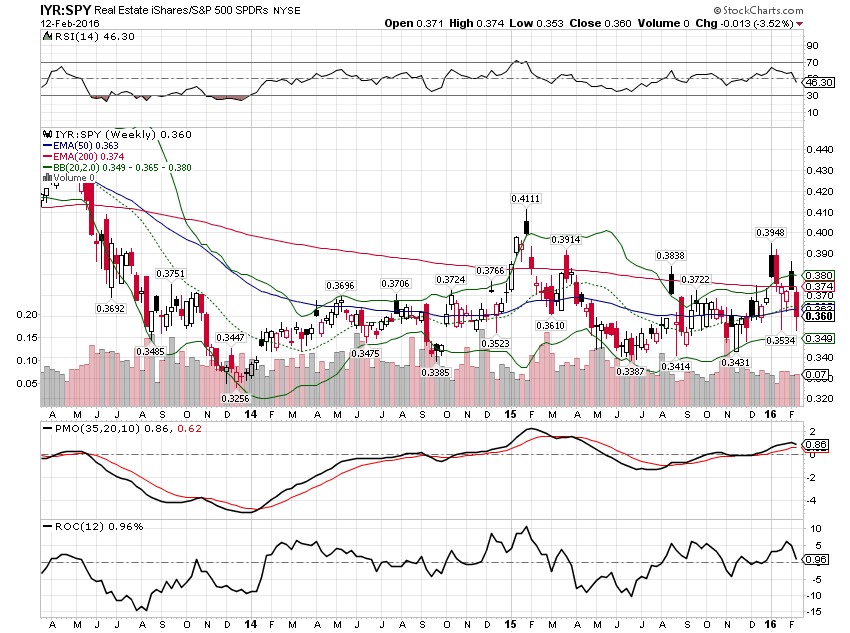
REITs (N:IYE) have underperformed this year but the longer term trend still justifies a position:
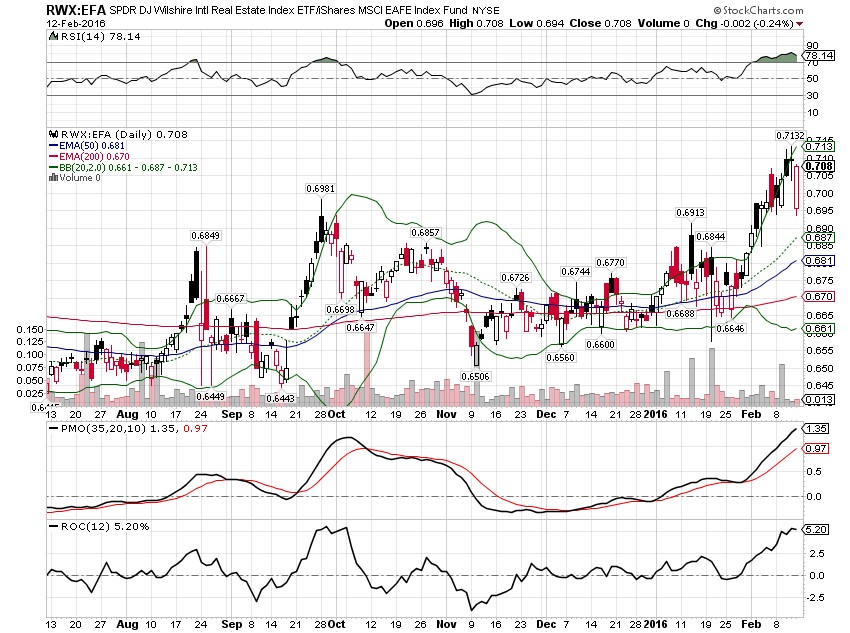
International REITs (N:RWX), on the other hand, have outperformed the EAFE (N:EFA) by a wide margin so far this year:
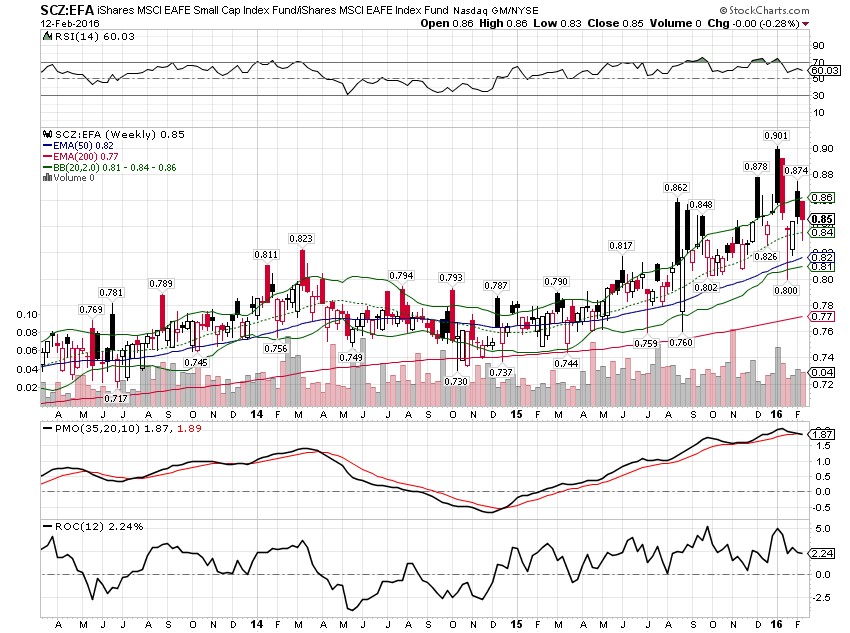
EAFE small cap (N:SCZ) continues to outperform:
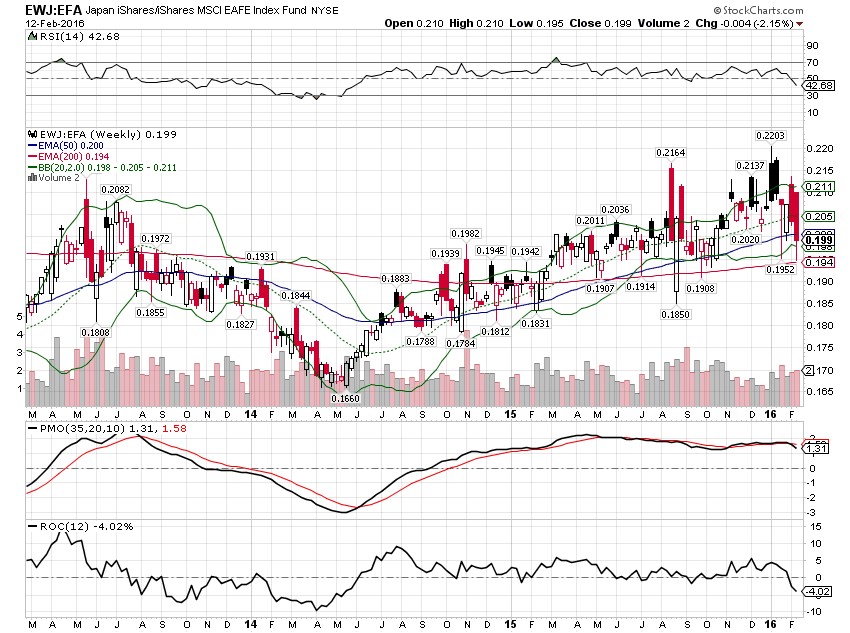
Japan (N:EWJ) has broken down badly the last couple of weeks but the longer term trend versus EAFE is still positive:
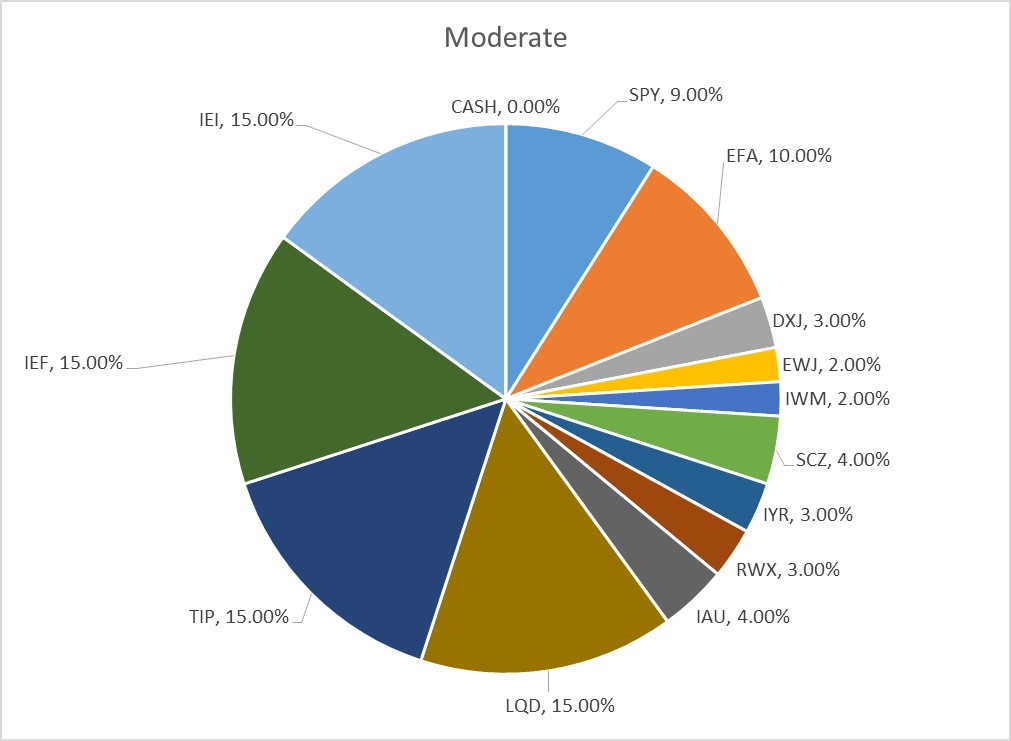
There are some changes to the allocations this month. The changes to the moderate allocation are presented here. Contact us if you’d like to discuss other risk tolerances as they are somewhat different than the changes to the moderate portfolio:
- In the bond allocation, I am taking profits on the 10-20 year Treasury ETF (N:TLH) and replacing it with the N:TIP ETF.
- The overweight to EFA over N:SPY is reduced. From a valuation standpoint, EFA is still the better choice but the fact is that this still isn’t working as the US has continued to outperform on the downside. The overweight is maintained but reduced.
- The Japan allocation is maintained but split between N:DXJ and EWJ. We have owned DXJ for several years and the move this month was an awakening that the risk of maintaining the short Yen position had become too great to ignore. The short yen trade is still crowded and if it sells off more soon we may get out of DXJ altogether.
Here’s how the allocation looks now:
“Wealth preservation and accumulation through thoughtful investing.”
This material has been distributed for informational purposes only. It is the opinion of the author and should not be considered as investment advice or a recommendation of any particular security, strategy, or investment product. Investments involve risk and you can lose money. Past investing and economic performance is not indicative of future performance. Alhambra Investment Partners, LLC expressly disclaims all liability in respect to actions taken based on all of the information in this writing. If an investor does not understand the risks associated with certain securities, he/she should seek the advice of an independent adviser.
