General Motors (NYSE:GM) reports third-quarter earnings before market open on Wednesday, October 31. After a string of reports from Ford (F) and Tesla (NASDAQ:TSLA) that beat expectations, analysts and investors are waiting to see if GM can do the same tomorrow morning.
For Q3, GM is expected to report adjusted EPS of $1.25 on revenue of $34.85 billion, according to third-party consensus analyst estimates. In the same quarter last year, adjusted EPS came in at $1.32 on revenue of $33.62 billion.
Naturally, trade wars and tariffs, and how that’s impacting material costs, will be a big focus for analysts and investors on tomorrow’s call. When the company last reported, CEO Mary Barra acknowledged that there were a lot of different ways the situation with both NAFTA and China trade could play out. She also pointed out that some regions have more localized production than others, so the company’s various markets will be affected differently.
Foreign exchange headwinds are also expected to continue to weigh on third-quarter results. In the second quarter, the company specifically called out the negative impact of depreciation in the Brazilian real and the Argentine peso when it revised its full-year outlook.
Both of those currencies weakened relative to the U.S. dollar in Q3. The Chinese yuan has weakened relative to the U.S. dollar as well, which analysts are expecting to impact GM’s China business.
Q3 Deliveries
Per usual, GM has already released its Q3 delivery figures. For the quarter, GM reported that sales in the U.S. declined 11% year over year to 694,638 vehicles. At the same time, average transaction prices (ATPs) were up roughly $700 to $35,974. Management attributed the increased ATPs to both lower incentive spending and selling more higher-priced trucks, SUVs, and crossovers.
GM’s Chief Economist Elaine Buckberg struck an optimistic note saying “the U.S. economy and auto industry remains strong.” The concern that is coming up more among analysts and investors is how long can it last?
In China, GM said sales were down 14.9% year over year to 835,934 vehicles, faster than the 2.5% decline in the first nine months of 2018. GM indicated that the vehicle market in China continues to soften and that its strategy there would be to continue to focus on the areas where demand is strongest: SUVs, multi-purpose vehicles (MPVs) and luxury vehicles.
Cruise and Driverless Cars
GM announced that Honda (HMC) would invest a total of $2.75 billion in Cruise, the driverless car subsidiary of GM. As part of the deal, HMC would invest an initial $750 million in exchange for equity and contribute an additional $2 billion over the next 12 years.
Under the arrangement, “Honda will work jointly with Cruise and General Motors to fund and develop a purpose-built autonomous vehicle for Cruise.” The two also said they would explore “global opportunities for commercial deployment of the Cruise network.”
Not too long ago, GM also announced that SoftBank Group Corp (OTC:SFTBY) would invest $2.25 billion for a 19.6% stake in Cruise. The latest round of investments puts Cruise’s valuation at $14.6 billion.

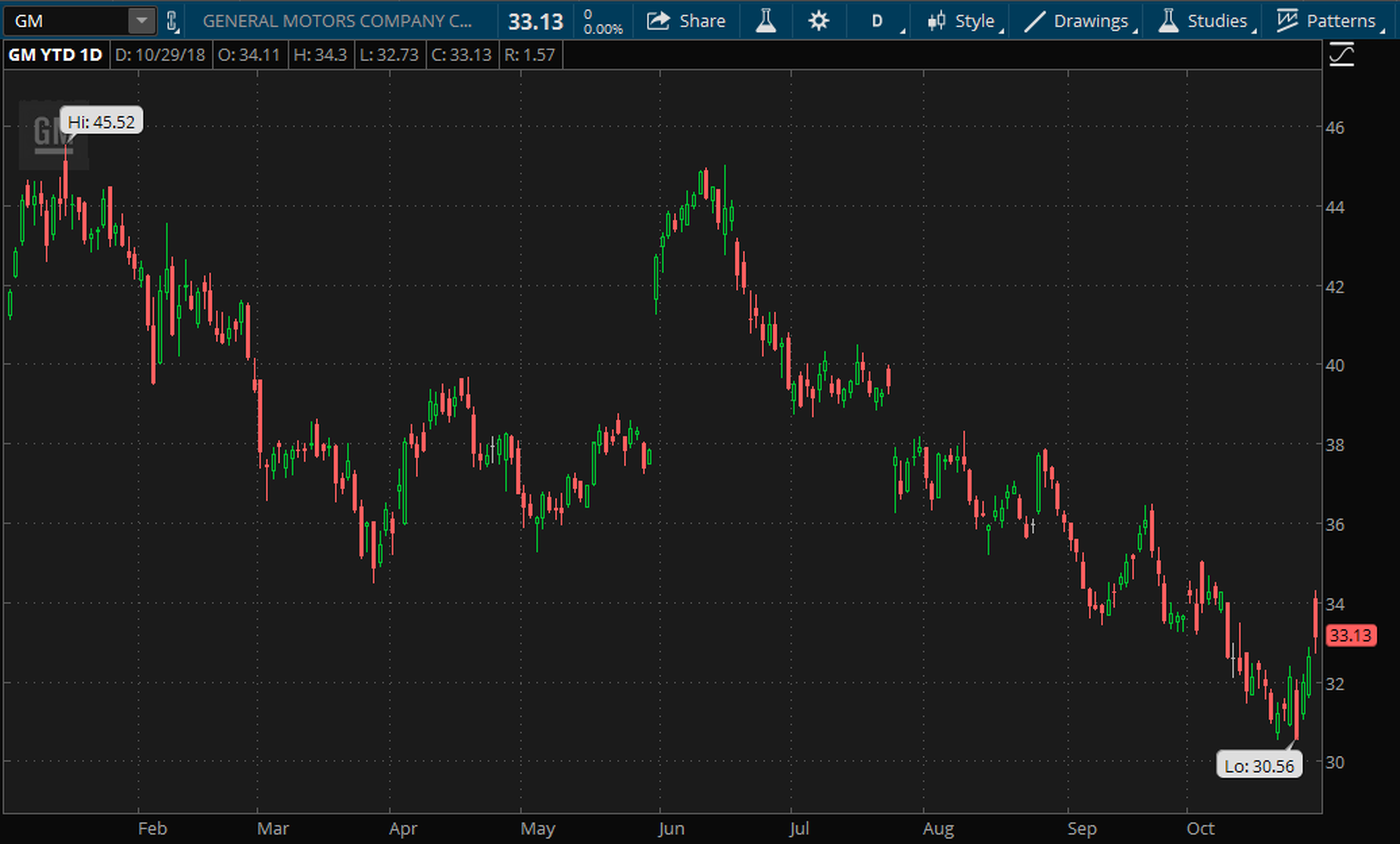
Downward Channel. GM has been stuck in a pretty narrow downward channel for the past several months. Heading into earnings, the stock is not too far off of its 52-week low of $30.56, which is around the lows of 2017. Chart source: thinkorswim® by TD Ameritrade. Not a recommendation. For illustrative purposes only. Past performance does not guarantee future results.
GM Options Activity
Options traders have priced in a 5.8% stock move in either direction around the earnings release, according to the Market Maker Move indicator on the thinkorswim® platform. Implied volatility was at the 100th percentile as of this morning.
In short-term trading at the Nov. 2 weekly expiration, call activity has been concentrated a the 34.5 strike price, while trading on the put side has been concentrated at the 31.5 strike.
In a few weeks at the Nov. 16 monthly expiration, calls have been active at the 34 and 35 strike prices. There hasn’t been a whole lot of volume for puts in recent trading, although open interest is higher at the 36-strike put.
The 30-strike put at the Dec. 21 monthly expiration has also seen heavier trading. During yesterday’s session, that strike had volume of 10,170 contracts.
Note: Call options represent the right, but not the obligation, to buy the underlying security at a predetermined price over a set period of time. Put options represent the right, but not the obligation to sell the underlying security at a predetermined price over a set period of time.
TD Ameritrade® commentary for educational purposes only. Member SIPC. Options involve risks and are not suitable for all investors. Please read Characteristics and Risks of Standardized Options.
