🔮 Better than the Oracle? Our Fair Value found this +42% bagger 5 months before Buffett bought itRead More

Gaps Intact

Published 03/17/2016, 01:24 AM
Updated 07/09/2023, 06:31 AM
US500
-
DJI
-
DJT
-
DJA
-
HUI
-
SOX
-

This evening, I got my latest Short-Term Update from Elliott Wave International, and this graph jumped out at me:
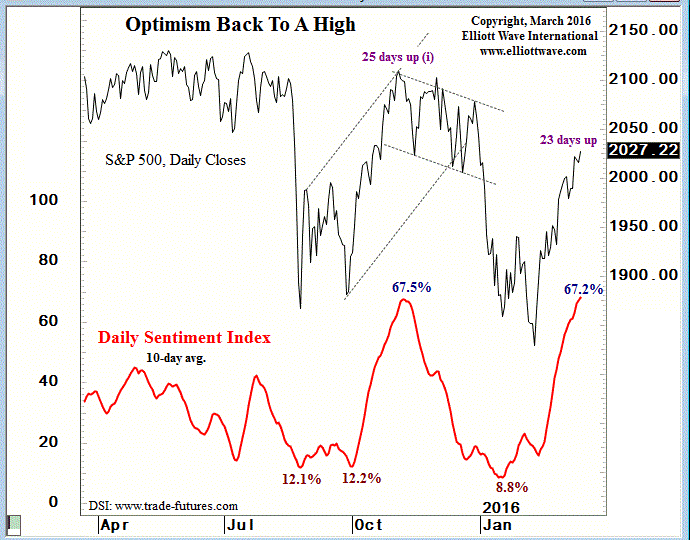
Optimism Back To A High

We seem to be back in “real soon now” mode (e.g. “this insane countertrend rally will stop and we will get sinking prices again…………..real soon now.”) That’s all well and good, but it just doesn’t seem to be happening. Of course, after the Fed did their announcement, there were a couple of times when it looked like the jig was up, but, nope – – the market ultimately pushed higher.

The worst bit of news for the bears was that the Dow Jones Composite violated its intermediate-term trendline. The strength of the Utilities had something to do with this, but I’m not going to try to spin this; it’s not good.
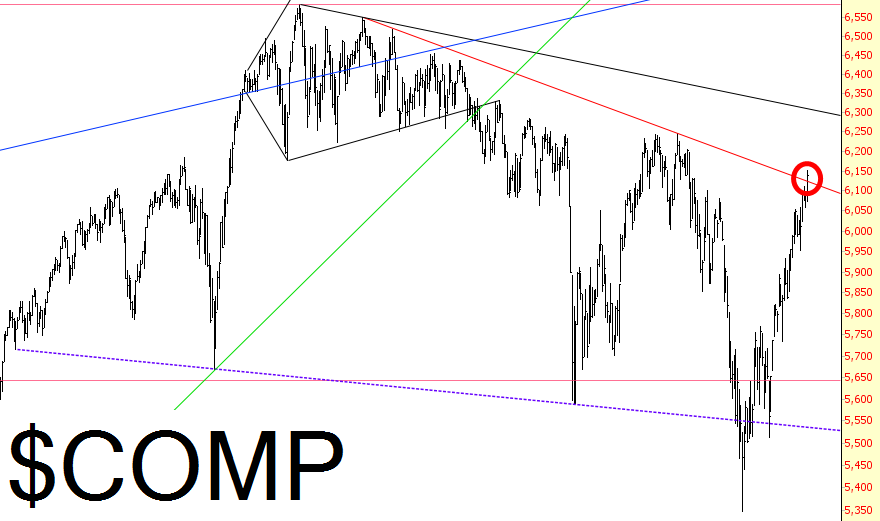
Comp Chart

I was enthused to see precious metals (and miners) continue to be strong, and as big a fan as I am of them, I think the trendline shown below suggests caution (unless we rip right through it, in which case we’re truly dealing with a new era here).
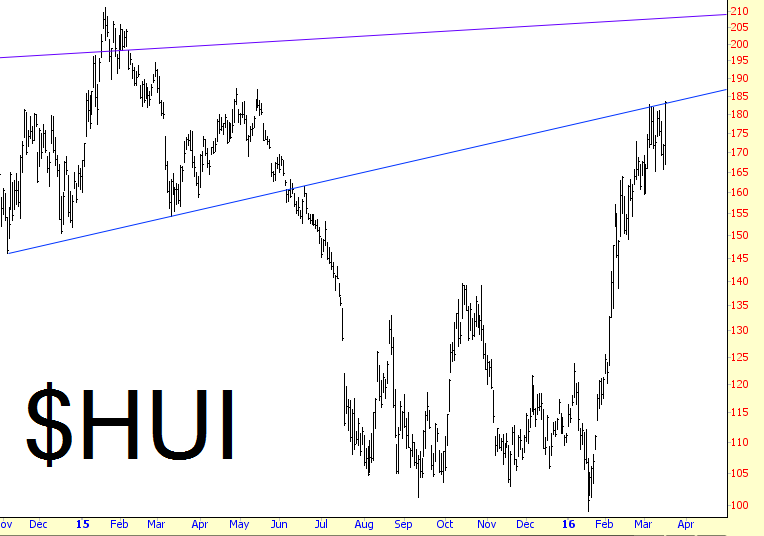
HUI Chart

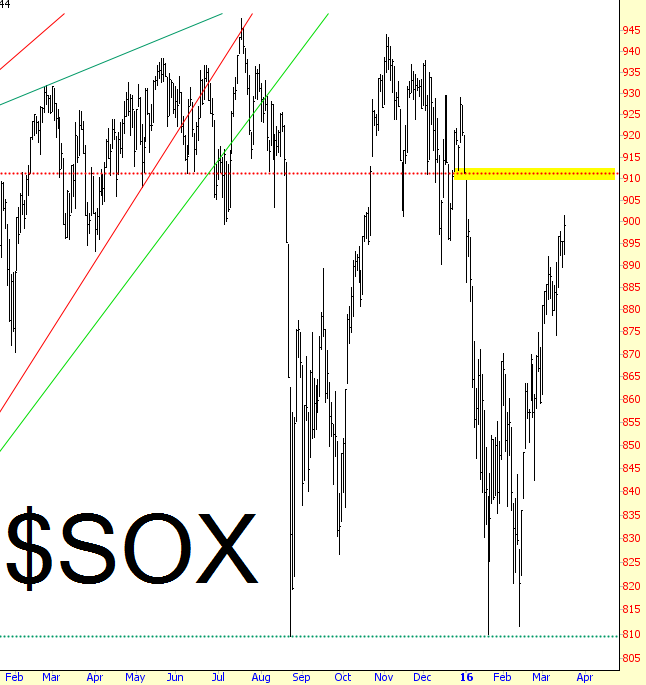
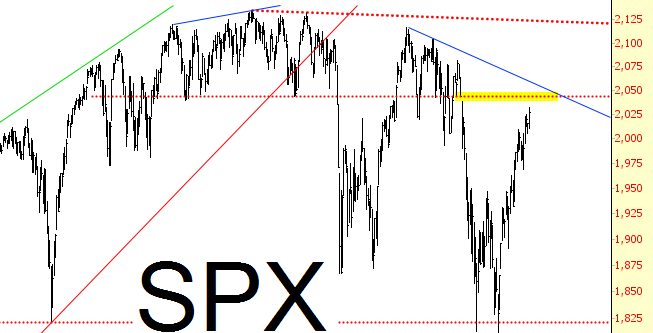
All is not lost, however, because there are many gaps neatly in place. The most typical gap is between December 31, 2015 and January 5, 2016, and it is tantalizingly close to being close in many indexes, such as the Dow 30:
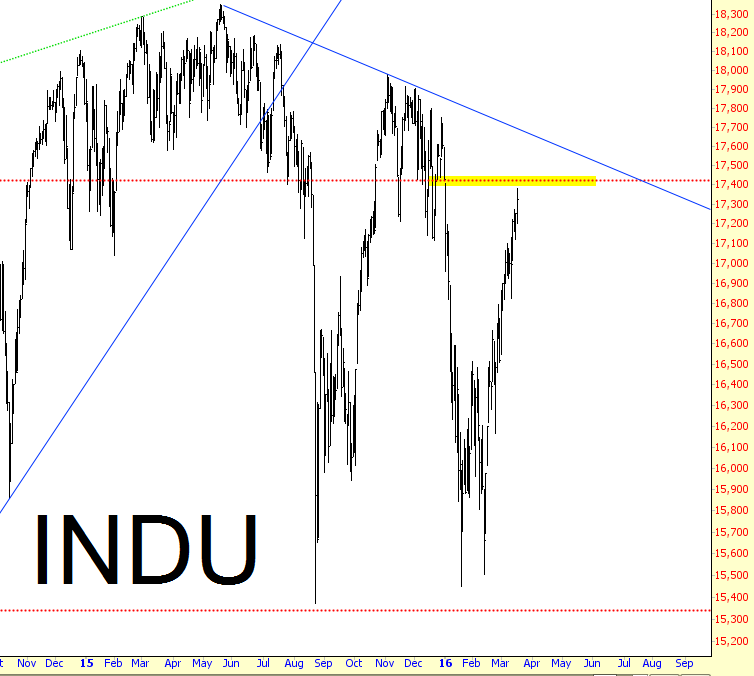
INDU Chart

And the semiconductor index:

SOX Chart

And the S&P 500:

SPX Chart

In addition, the Dow Transports (which one would think would be under pressure from rapidly-soaring fuel costs) is just underneath its enormous topping pattern.
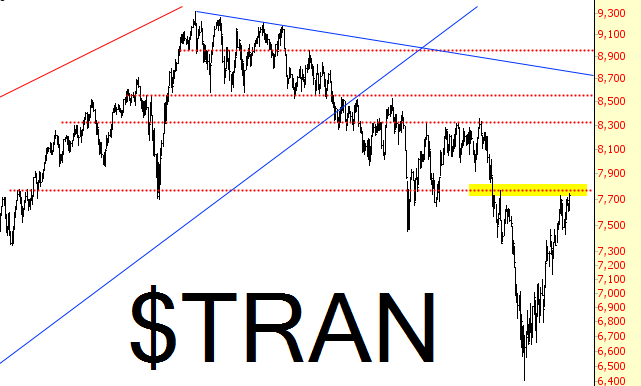
Tran Chart

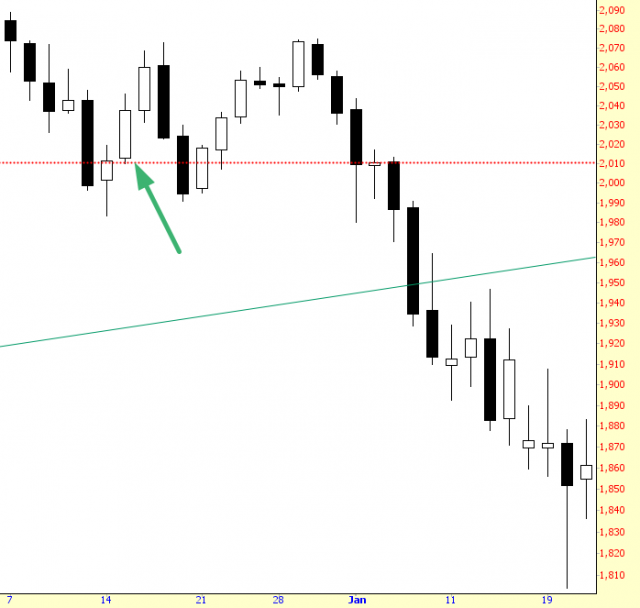
As one last slim hope to offer, I’ll say this: the last “big” Fed announcement (in which you get the press conference) was back in mid-December, and the market was very enthused back then, too (and that enthusiasm spilled over into the next day). It took the market about a week more to figure things out, then………the thrill was gone.
Chart

Latest comments

Loading next article…
Risk Disclosure: Trading in financial instruments and/or cryptocurrencies involves high risks including the risk of losing some, or all, of your investment amount, and may not be suitable for all investors. Prices of cryptocurrencies are extremely volatile and may be affected by external factors such as financial, regulatory or political events. Trading on margin increases the financial risks.
Before deciding to trade in financial instrument or cryptocurrencies you should be fully informed of the risks and costs associated with trading the financial markets, carefully consider your investment objectives, level of experience, and risk appetite, and seek professional advice where needed.
Fusion Media would like to remind you that the data contained in this website is not necessarily real-time nor accurate. The data and prices on the website are not necessarily provided by any market or exchange, but may be provided by market makers, and so prices may not be accurate and may differ from the actual price at any given market, meaning prices are indicative and not appropriate for trading purposes. Fusion Media and any provider of the data contained in this website will not accept liability for any loss or damage as a result of your trading, or your reliance on the information contained within this website.
It is prohibited to use, store, reproduce, display, modify, transmit or distribute the data contained in this website without the explicit prior written permission of Fusion Media and/or the data provider. All intellectual property rights are reserved by the providers and/or the exchange providing the data contained in this website.
Fusion Media may be compensated by the advertisers that appear on the website, based on your interaction with the advertisements or advertisers.
© 2007-2024 - Fusion Media Limited. All Rights Reserved.