
The monthly employment report is among the most popular and controversial of the government's economic reports. The latest one, released on Friday, was especially controversial. Shortly after the data was released, David Rosenberg's subscription newsletter featured Ten Reasons to Love the U.S Employment Report, which were paraphrased for the general public by Business Insider. That same morning I featured a contrarian view by Michael Lombardi, What the Worst Jobs Report of the Year Means to You.
One of the reasons the monthly employment report is so controversial is that it is an incredible hodgepodge of data from bipolar sources: the Current Population Survey (CPS) of households and the Establishment Survey of businesses and government agencies. For example, the unemployment rate is calculated from household data, but the Nonfarm Employment number comes from the establishment data.
Full-Time vs. Part-Time Employment
Let's take a close look at some CPS numbers on Full and Part-Time Employment. Buried near the bottom of Table A-9 of the Household Data are the numbers for Full- and Part-Time Workers, with 35-or-more hours as the arbitrary divide between the two categories. The Labor Department has been collecting this since 1968, a time when only 13.5% of US employees were part-timers. Today that number has risen to 19.5%.
Here is a visualization of the trend in the 21st century, with the full-time percentage on the left axis and the part-time percentage on the right. We see a conspicuous crossover during Great Recession.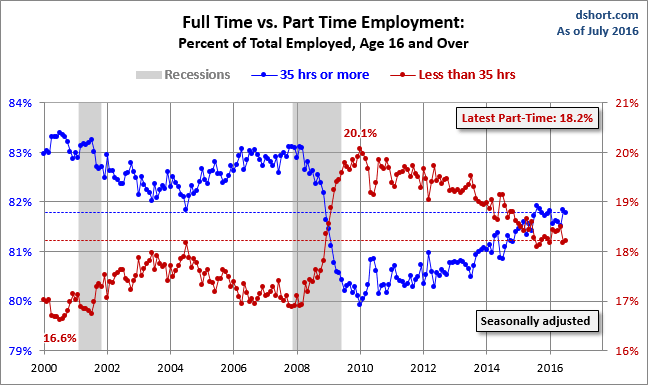
Here is a closer look since 2007. The reversal began in 2008, but it accelerated in the Fall of that year following the September 15th bankruptcy of Lehmann Brothers. In this seasonally adjusted data the reversal peaked in early 2010. Three-and-a-half years later the spread has narrowed a bit, but we're a long way from returning to the ratio before the Great Recession.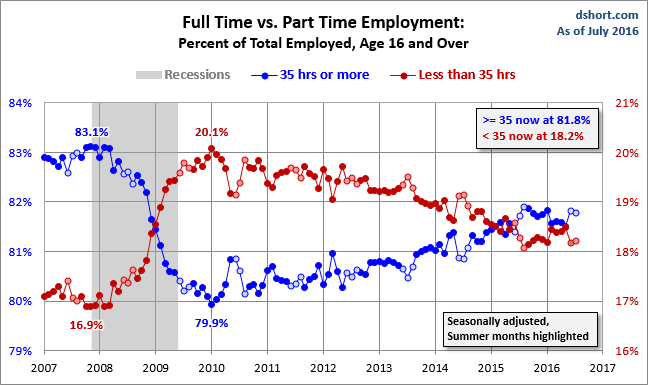
The two charts above are seasonally adjusted and include the entire workforce, which the CPS defines as age 16 and over. A problem inherent in using this broadest of cohorts is that it includes the population that adds substantial summertime volatility to the full-time/part-time ratio, namely, high school and college students.
The next chart reduces that problem by focusing on the 25-and-over cohort. Note that the government's full-time/part-time data for this cohort is only available as non-seasonally adjusted. To help us recognize the summer seasonality that remains, I've tweaked this representation by adding markers for the individual months and highlighting the summer months, which are the most subject to increases in 35-plus hours of employment. I've also included 12-month moving averages for the two series to help us identify the slope of the trend over the past three years.
Like the 16-and-over version, this chart depicts a current situation that is considerably different from the era before the Financial Crisis. Despite the general smiles on Friday about the 195K Nonfarm Jobs in June and upward revisions to previous months, the latest full-time/part-time data points are a bit concerning. The spread for June 2013 is wider than the three previous Junes.
It is certainly possible that the Affordable Care Act (aka Obamacare) is playing a role in employer decisions about full-time versus part-time employment. The $2,000 per employee penalty for employers who do not comply with regulations has influenced some employers to begin shifting their employment policies. Earlier this month President Obama pushed the start of the penalty from January 2014 to January 2015. But the June CPS data would have preceded that extension. Moreover, the anticipation of the penalty, even though delayed a year, will probably continue to influence the interim decisions of private employers.
As I mentioned at the outset, the monthly employment report is a hodgepodge of data. The full-time/part-time ratio is but a tiny piece of the whole, and the magic 35-hour threshold is arguably arbitrary. But this is, nevertheless, a metric that bears watching in the months ahead as we try to understand where the economy is headed.
My data source for the charts and numbers in the commentary is the BLS's Databases & Tools page -- specifically the Labor Force Statistics here.
- English (UK)
- English (India)
- English (Canada)
- English (Australia)
- English (South Africa)
- English (Philippines)
- English (Nigeria)
- Deutsch
- Español (España)
- Español (México)
- Français
- Italiano
- Nederlands
- Português (Portugal)
- Polski
- Português (Brasil)
- Русский
- Türkçe
- العربية
- Ελληνικά
- Svenska
- Suomi
- עברית
- 日本語
- 한국어
- 简体中文
- 繁體中文
- Bahasa Indonesia
- Bahasa Melayu
- ไทย
- Tiếng Việt
- हिंदी
Full-Time Vs. Part Time Employment: A Closer Look
Published 07/11/2013, 01:35 AM
Updated 07/09/2023, 06:31 AM
Full-Time Vs. Part Time Employment: A Closer Look
Latest comments
Loading next article…
Install Our App
Risk Disclosure: Trading in financial instruments and/or cryptocurrencies involves high risks including the risk of losing some, or all, of your investment amount, and may not be suitable for all investors. Prices of cryptocurrencies are extremely volatile and may be affected by external factors such as financial, regulatory or political events. Trading on margin increases the financial risks.
Before deciding to trade in financial instrument or cryptocurrencies you should be fully informed of the risks and costs associated with trading the financial markets, carefully consider your investment objectives, level of experience, and risk appetite, and seek professional advice where needed.
Fusion Media would like to remind you that the data contained in this website is not necessarily real-time nor accurate. The data and prices on the website are not necessarily provided by any market or exchange, but may be provided by market makers, and so prices may not be accurate and may differ from the actual price at any given market, meaning prices are indicative and not appropriate for trading purposes. Fusion Media and any provider of the data contained in this website will not accept liability for any loss or damage as a result of your trading, or your reliance on the information contained within this website.
It is prohibited to use, store, reproduce, display, modify, transmit or distribute the data contained in this website without the explicit prior written permission of Fusion Media and/or the data provider. All intellectual property rights are reserved by the providers and/or the exchange providing the data contained in this website.
Fusion Media may be compensated by the advertisers that appear on the website, based on your interaction with the advertisements or advertisers.
© 2007-2024 - Fusion Media Limited. All Rights Reserved.