Markets are waiting for the Fed to take a decision regarding the U.S. Interest Rate. U.S. Nonfarm Payrolls beated forecasts but wage inflation didn’t.
The ECB resisted pressure to start tightening monetary policy, saying that it stands ready to extend the size or the duration of its asset purchase program if the economic outlook worsens.
German Unemployment Change better than expected, German Manufacturing slowed down a little bit. German GDP below expectations added to the concerns remain about the outside chance of a victory by far-right French presidential candidate Marine Le Pen.
Greek bailout uncertainty also added to pressure on the euro.
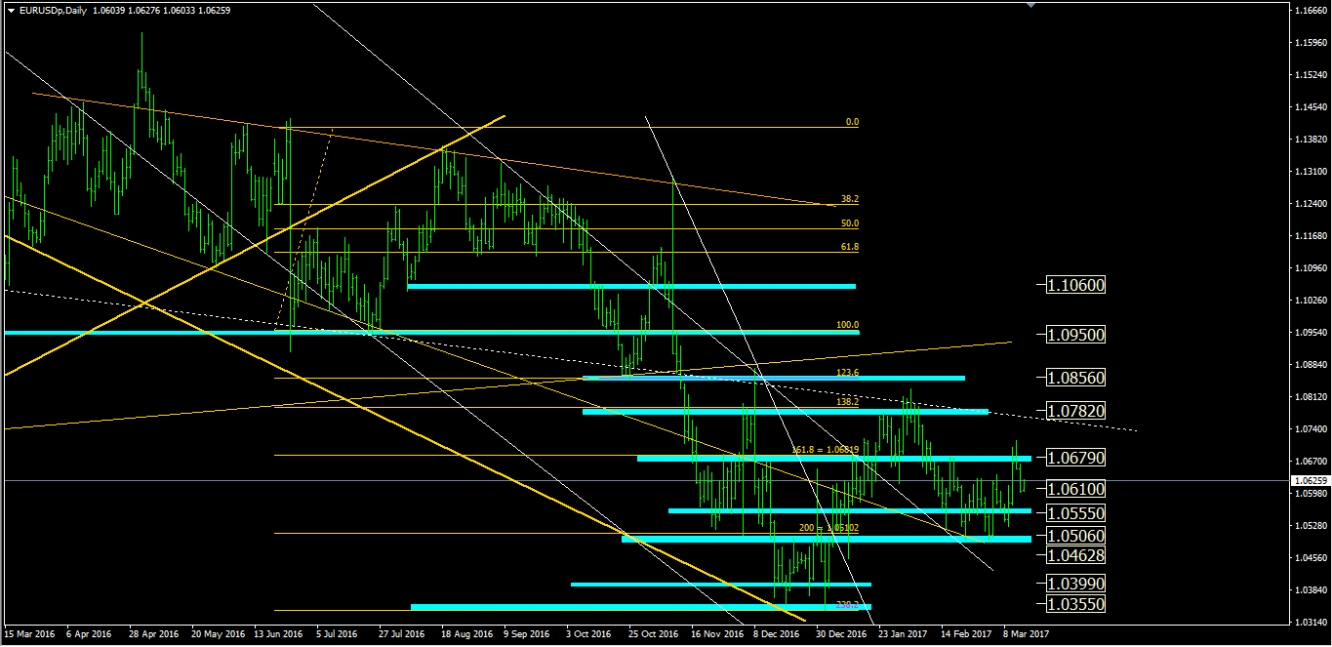
As we wrote previously, resistance area nearby current price at1.0679 rejects price down.
Investor sentiment remained cautious about USD as nothing is really clear about fiscal, tax and regulatory policy under the Trump administration but now things may change abruptly.
Our special Fibo Retracement is confirming the following S/R levels against the monthly and weekly trendlines obtained by connecting the relevant highs and lows back to 2012:
Weekly Trend: Bearish
1st Resistance: 1.0679
2nd Resistance: 1.0782
1st Support: 1.0555
2nd Support: 1.0506
EUR
Recent Facts:
31st of January, German Unemployment Change
Better than expected.
31st of January, Eurozone’s CPI and GDP preliminary release
Better than expected.
1st of February, Eurozone Manufacturing PMI
As expected.
9th of February, German Trade Balance
Worse than expected.
10th of February, French Industrial Production + French Non-Farm Payrolls
French Industrial Production worse than expected, French Non-Farm Payrolls better than expected.
14th of February: German GDP (Preliminary release) + German ZEW Economic Sentiment + Eurozone GDP (Preliminary release)
German GDP worse than expected, German ZEW worse than expected, Eurozone GDP worse than expected.
15th of February, Eurozone Trade Balance
Better than expected.
21st of February, German Manufacturing PMI
Better than expected.
23rd of February, German GDP
Worse than expected.
1st of March, German Manufacturing + German Unemployment Change
German Manufacturing worse than expected, German Unemployment Change better than expected.
2nd of March, Eurozone Inflation data
In line with expectations.
3rd of March, German Services PMI + Eurozone Retail Sales
Worse than expected.
7th of March, Germany Factory Orders
Worse than expected.
8th of March, German Industrial Production
Better than expected.
9th of March, ECB Interest Rate decision + ECB Press Conference
Interest Rates unchanged, ECB President Dovish (can be cut again in the future if necessary).
14th of March, German CPI + German ZEW Economic Sentiment
German CPI as expected, German ZEW worse than expected.
USD
Recent Facts:
2nd of December: Nonfarm Payrolls + Unemployment Rate
Better than expected.
27th of January, GDP + Durable Good Orders
GDP significantly worse than expected, Durable Good Orders as expected.
1st of February, ADP Nonfarm Unemployment Change + U.S. Institute for Supply Management Manufacturing
Better than expected (ISM Manufacturing at its highest level since November 2014).
3rd of February, Nonfarm Payrolls + Unemployment Rate
Nonfarm Payrolls better than expected, Unemployment Rate worse than expected.
14th of February, Producer Price Index (PPI)
Better than expected.
15th of February, Core CPI (Consumer Price Index) + Retail Sales
Better than expected.
16th of February, Building Permits + Initial Jobless Claims + Philadelphia Fed Manufacturing Index
Better than expected.
21st of February, Manufacturing PMI + Services PMI
Worse than expected.
27th of February, Core Durable Good Orders + Pending Home Sales
Worse than expected.
28th of February, GDP (Preliminary release)
Worse than expected.
3rd of March, ISM Non-manufacturing PMI + Fed Chair Yellen Speech
ISM Non-manufacturing PMI better than expected, Yellen noted that a rate increase at next meeting "would likely be appropriate" insisting on the condition that data on employment and inflation have to move in line with expectations.
8th of March, ADP Nonfarm Employment Change
Better than expected.
10th of March, Nonfarm Payrolls + Unemployment Rate
Better than expected.
14th of March, Producer Price Index
Higher than expected.
Eyes on today release: Core CPI + Retail Sales.
Eyes on today release: FOMC Economic Projections + FOMC Statement + Fed Interest Rate Decision + FOMC Press Conference.
Markets are waiting for the Fed to take a decision regarding the U.S. Interest Rate. U.S. Nonfarm Payrolls beated forecasts but wage inflation didn’t.
Eyes on today job market’s data. UK Manufacturing Production printed another negative number, while Trade Balance is better than expected.
UK Services PMI below expectations. Also UK Manufacturing PMI and GDP below the expectations. Moreover, during last meeting BoE said that monetary policy could move in either direction.
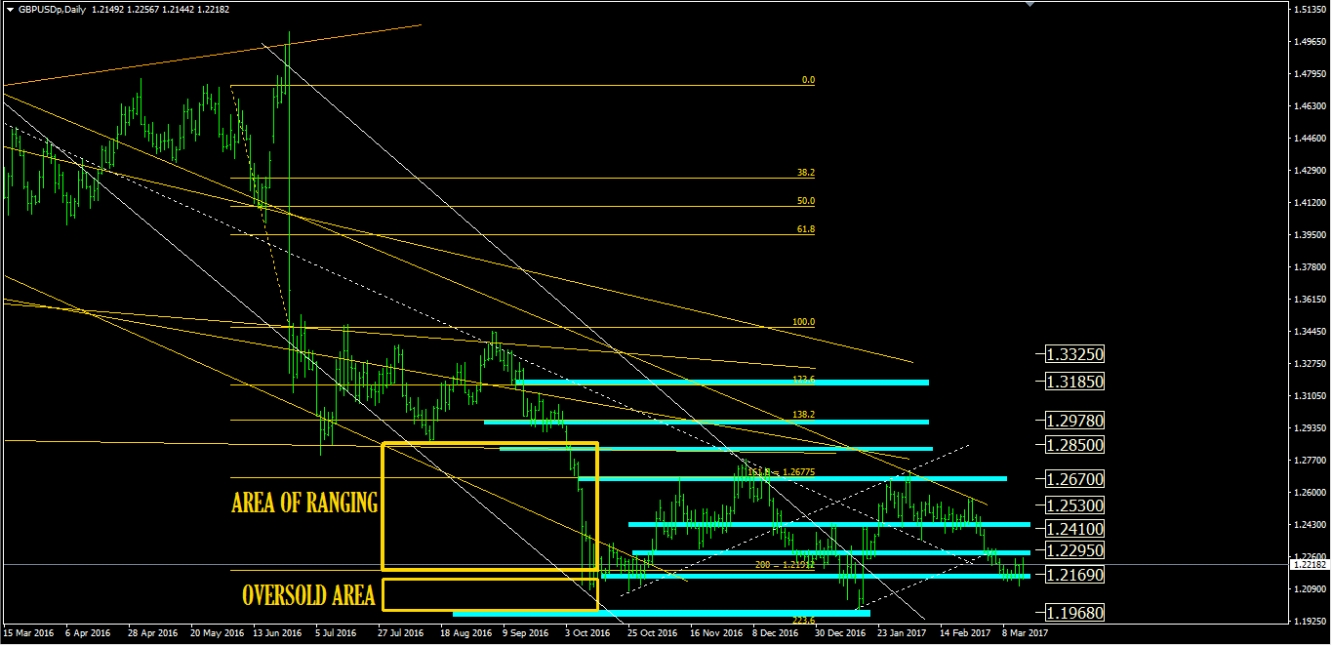
Test of 1.217 ongoing. A failure of this level would consequently lead down to 1.197 area as next target.
Our special Fibo Retracement is confirming the following S/R levels against the monthly and weekly trendlines obtained by connecting the relevant highs and lows back to 2001:
Weekly Trend: Overbought
1st Resistance: 1.2295
2nd Resistance: 1.2410
1st Support: 1.2169
2nd Support: 1.1968
GBP
Recent Facts:
4th of August, Bank of England Interest Rates decision (expected a cut)
Bank of England lowers Interest Rates as expected (record low of 0.25%) and increases purchase program.
20th of January, Retail Sales
Worse than expected.
26th of January, GDP (Preliminary release)
Better than expected.
1st of February, UK Manufacturing PMI
As expected.
2nd of February, Construction PMI
Worse than expected.
3rd of February, Services PMI
Worse than expected.
10th of February, Manufacturing Production
Better than expected.
14th of February, Consumer Price Index (CPI)
Worse than expected.
15th of February, Job Market
Better than expected.
17th of February, Retail Sales
Worse than expected.
1st of March, Manufacturing PMI
Worse than expected.
2nd of March, Construction PMI
Better than expected.
3rd of March, Services PMI
Worse than expected.
10th of March, Manufacturing Production + Trade Balance
UK Manufacturing Production worse than expected, Trade Balance better than expected.
Eyes on today release: Job Market.
USD
Recent Facts:
See above.
Markets are waiting for the Fed to take a decision regarding the U.S. Interest Rate. China Industrial Production marks a progress higher than expected U.S. Nonfarm Payrolls beated forecasts but wage inflation didn’t.
RBA held Interest Rates unchanged at 1.50% as expected.
Significantly worse than expected trade balance was a sharp reminder of the damage that a strong currency can do to an export dependent economy. Last print of Australia GDP was better than expected. Eyes on today China’s Industrial Production.
In Australia, private sector credit gained 0.2%, below the 0.5% hike expected, while the current account for the fourth quarter came in at a deficit wider than expected. Also in New Zealand the trade balance for January came in at a deficit wider than the gap expected.
There are some speculation that the economy may need more monetary help going forward. The Reserve Bank of Australia recently affirmed the scope for more rate cuts is slim to none from the current record low of 1.5%.
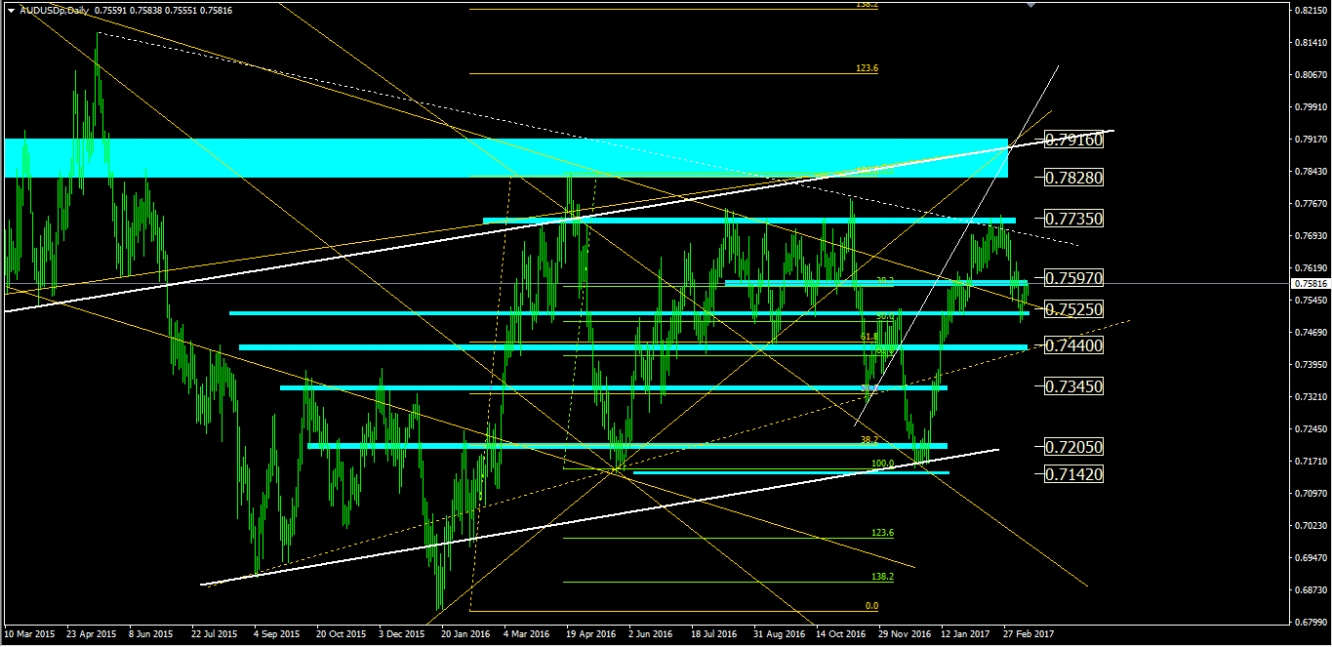
Important support around 0.75 area likely to be tested again.
Our special Fibo Retracements are confirming the following S/R levels against the monthly and weekly trendlines obtained by connecting the relevant highs and lows back to 2012:
Weekly Trend: Bearish
1st Resistance: 0.7597
2nd Resistance: 0.7735
1st Support: 0.7525
2nd Support: 0.7440
AUD
Recent Facts:
1st of November, RBA Interest Rates Statement
RBA’s Governor Lowe signals tolerance for weak inflation and bets seem off for future rate cuts.
3rd of November, RBA Monetary Policy Statement + Retail Sales
RBA said it is focused on the medium-term inflation target.
Retail Sales better than expected.
8th of November, ELECTION OF THE 45th PRESIDENT OF THE UNITED STATES
Donald Trump elected President.
9th of November, Reserve Bank of New Zealand Interest Rate Decision + Monetary Policy Statement
Interest Rates cut to 1.75% from 2.00% as expected.
19th of December, Mid-Year Economic and Fiscal Outlook
Scott Morrison announced lower than an original prediction of A$37.1 billion, investors see it as promising to stave off a downgrade of its AAA (triple A) rating from S&P Global.
9th of January, Retail Sales
Worse than expected.
19th of January, Employment Change
Better than expected.
25th of January, CPI (Consumer Price Index measures the change in the price of goods and services from the perspective of the consumer)
Lower than expected.
1st of February, AIG Manufacturing Index
Worse than expected.
2nd of February, Building Approvals + Trade Balance
Better than expected.
7th of February, RBA Interest Rates Decision + RBA Rate Statement
RBA held steady as expected at a record low 1.50%, while noting better economic conditions with China.
8th of February, New Zealand Interest Rate Decision + RBNZ Monetary Policy Statement
Interest Rates unchanged and RBNZ’s agenda contains no changes for 2017.
16th of February, Employment Change
Better than expected.
28th of February, New Home Sales, Current Account, Private Sector Credit.
1st of March, Australia GDP
Better than expected.
USD
Recent Facts:
See above.


