
We make up a weekly medium-term trade list based on CFTC reports and technical analysis.
The overview provides a description of the technical condition of the market on the most popular financial instruments, as well as information on the large speculators’ actions according to the last COT reports and the previous period.
If you want to use CFTC reports in your trading practice, you should understand that for an objective assessment of the situation it’s not enough to know the data of the last report. The dynamic is more important, in other words, comparing the statistics of large speculators’ actions in the current period with the previous one, so we publish both values in the table.
E-Mini S&P 500 (ESZ17)
The trend is bullish, another correction came to an end last week and the impulse wave develops. Long positions will remain relevant until the market is above the nearest support level on the Daily timeframe, the lows of December 5-7.
COT net position indicator reversed following the market and the professionals’ opinion corresponds to the Daily trend direction.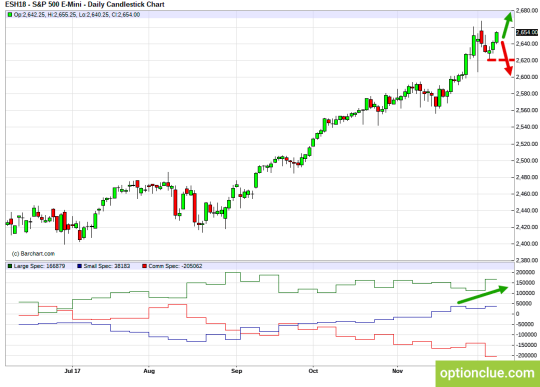
E-Mini S&P500 (ESZ17). Technical analysis and COT net position indicator.
American dollar broke through the resistance level on the Daily timeframe on Wednesday, the trend is bullish now and the impulse wave develops. A pullback buying opportunity on the Daily timeframe will appear after the correction formation. Long positions will remain relevant until the market is above the support level, the lows of December 1. COT net position indicator increased but didn’t reverse.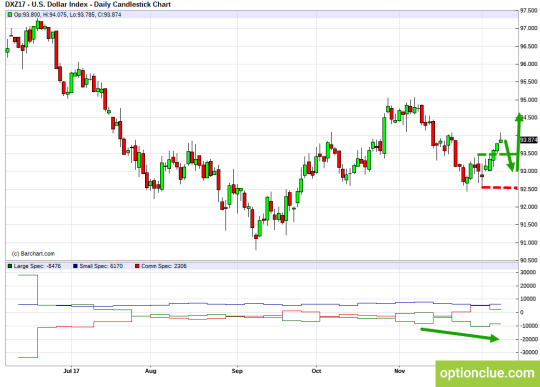
Dollar Index (DXY). Technical analysis and COT net position indicator.
Euro (EUR/USD)
Euro broke through the support level on the Daily timeframe on Wednesday, the trend is bearish now and the impulse wave develops. A pullback selling opportunity on the Daily timeframe will appear after the correction formation. Short positions will remain relevant until the market is below the resistance level, the highs of December 1-4.
COT net position indicator didn’t reverse following the market and the professionals’ opinion no longer corresponds to the Daily trend direction and it makes sense to reduce the position size when an entry point appears in the trend direction.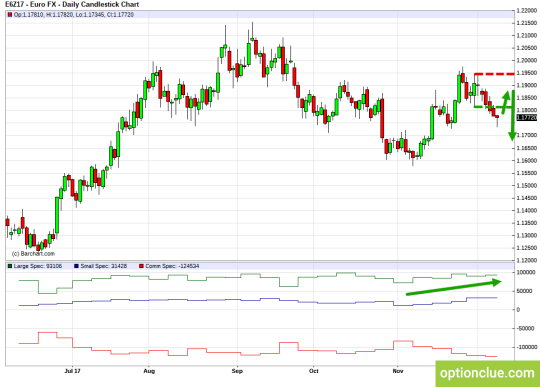
EUR/USD. Technical analysis and COT net position indicator.
Swiss Franc (USD/CHF)
USD/CHF currency pair broke through the resistance level on the Daily timeframe, the trend is bullish now and the impulse wave develops. Long positions will remain relevant until the market is above the support level, the lows of December 1-4.
COT net position indicator reversed and the professionals’ opinion doesn’t correspond to the Daily trend direction.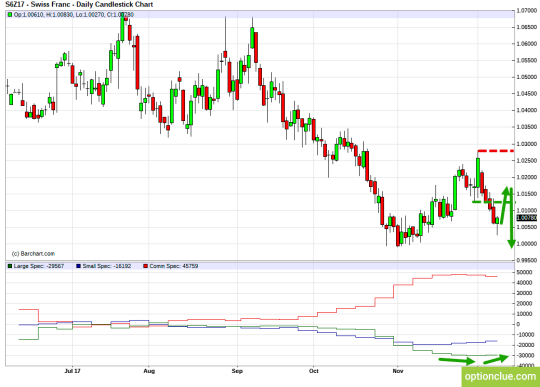
CHF/USD. Technical analysis and COT net position indicator.
British Pound (GBP/USD)
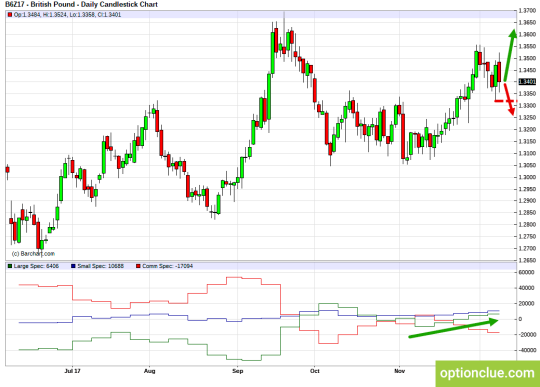
British pound remains in the uptrend, the correction came to an end last week and the impulse wave develops. Long positions will remain relevant until the market is above the nearest support level on the Daily timeframe, the lows of December 6-7.
CFTC reports indicate that large speculators go on buying pound, hedgers are selling and the professionals’ opinion corresponds to the market technical picture.
GBP/USD. Technical analysis and COT net position indicator.
Japanese Yen (USD/JPY)
USD/JPY currency pair broke through the resistance level on the Daily timeframe on Friday, the trend is bullish now and the impulse wave develops. A pullback buying opportunity on the Daily timeframe will appear after the correction formation.
Long positions will remain relevant until the market is above the support level, the lows of December 5-7.
COT net position indicator didn’t reverse following the market and the professionals’ opinion no longer corresponds to the Daily trend direction.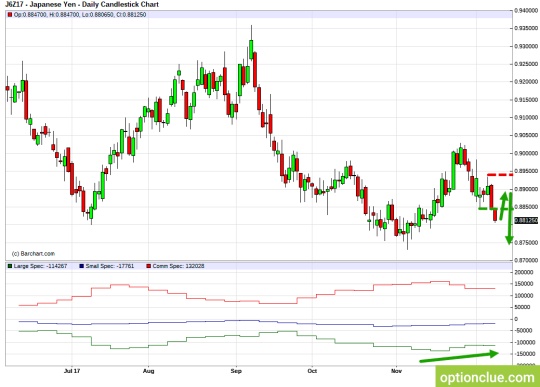
JPY/USD. Technical analysis and COT net position indicator.
WTI Crude Oil (CLF18)
The support level on the Daily timeframe on the oil market was broken on Wednesday, the trend is bearish now and the correction wave develops. A pullback selling opportunity may be formed soon. Short positions will remain relevant until the market is below the resistance level, the highs of December 1-4.
COT net position indicator didn’t reverse following the market and the professionals’ opinion doesn’t correspond to the Daily trend direction now.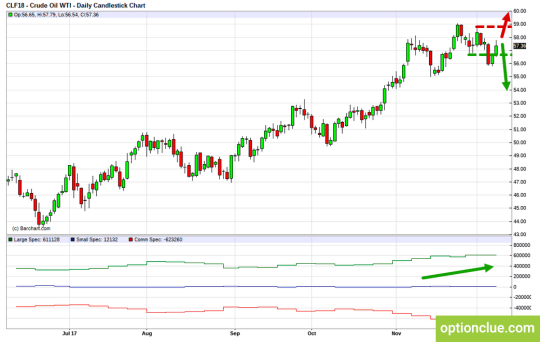
WTI Crude Oil (CLF18). Technical analysis and COT net position indicator.
Canadian Dollar (USD/CAD)
The trend is bullish (for USD/CAD), another correction came to an end last week and the impulse wave develops. USD/CAD long positions will remain relevant until the market is above the nearest support level on the Daily timeframe, the lows of December 1-6. Large speculators go on selling Canadian dollar, hedgers are buying and the professionals’ opinion corresponds to the market technical picture.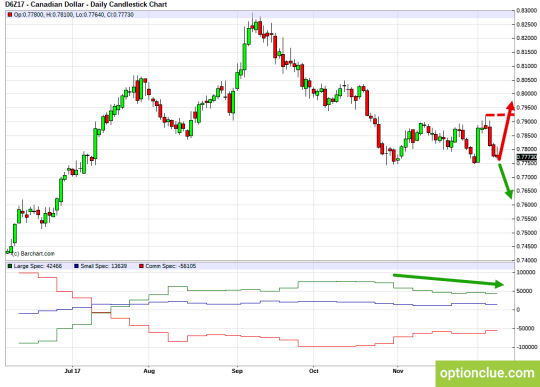
CAD/USD. Technical analysis and COT net position indicator.
Gold (XAU/USD)
The support level on the gold market was broken on the Daily timeframe on Tuesday, the trend is bearish now and the impulse wave develops. A pullback selling opportunity will appear after the correction formation.
Short positions will remain relevant until the market is below the resistance level, the highs of November 27-30. COT net position indicator reversed, large speculators began to sell actively, hedgers began to buy and the professionals’ opinion corresponds to the market technical picture.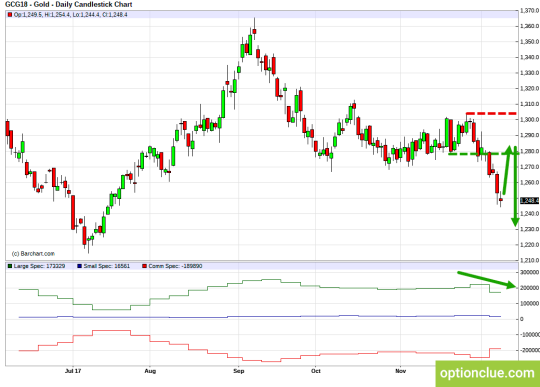
Gold (GCG18). Technical analysis and COT net position indicator.
Silver (XAG/USD)
The market remains in the downtrend and the impulse wave develops on the Daily timeframe. A pullback selling opportunity on the Daily timeframe will appear after the correction formation. Short positions will remain relevant until the market is below the resistance, the highs of November 22-28. Large speculators go on selling, hedgers are buying and the professionals’ opinion corresponds to the market technical picture.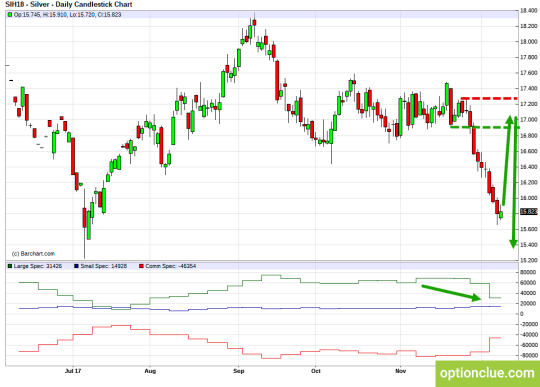
Silver (SIH18). Technical analysis and COT net position indicator.
Australian Dollar (AUD/USD)
The market remains in the downtrend and the impulse wave develops on the Daily timeframe. A pullback selling opportunity on the Daily timeframe will appear the correction formation. Short positions will remain relevant until the market is below the resistance level, the highs of December 1-6. Large speculators go on selling and the professionals’ opinion corresponds to the market technical picture.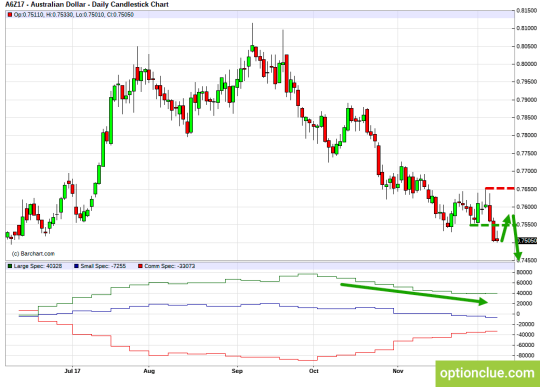
AUD/USD. Technical analysis and COT net position indicator.
New Zealand Dollar (NZD/USD)
The market is in the triangle on the Daily timeframe. Before the fact of the nearest support or resistance level breakout, new medium-term positions look unattractive. Previously opened bearish positions will remain relevant until the market is below the resistance level on the Daily timeframe, the highs of December 5-7.
COT net position indicator reversed, large speculators are buying and the probability of breaking through the triangle up increases.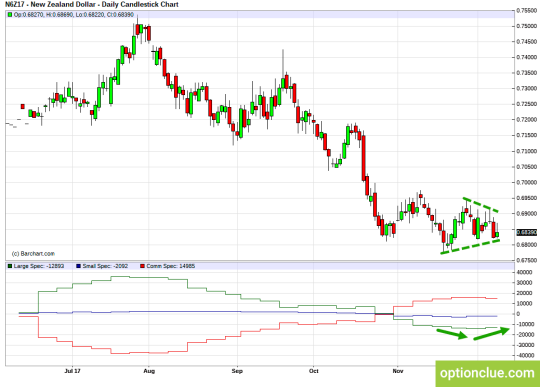
NZD/USD. Technical analysis and COT net position indicator.
Russian rouble (USD/RUB)
USD/RUB currency pair remains in the medium-term bear trend and the correction develops. A pullback selling opportunity will be formed after its completion and its relevance will depend on the market correction depth. COT net position indicator increases, large speculators go on buying and the professionals’ opinion corresponds to the market technical picture.
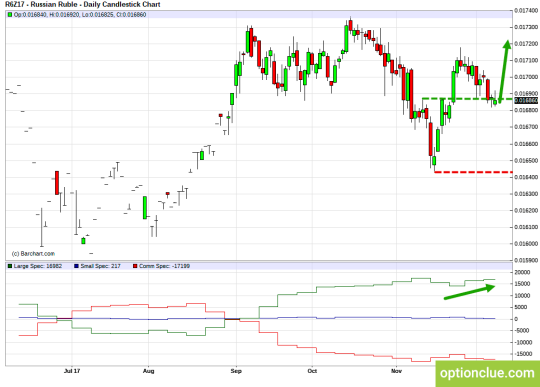
RUB/USD. Technical analysis and COT net position indicator.
Conclusions
In terms of medium-term trading, a financial instrument with the correction close to completion on the Daily timeframe and with potentially the most promising risk-reward ratio is AUD/JPY.
In the near future AUD/USD, EUR/USD, USD/JPY, USD/RUB, USD/CHF can become noteworthy depending on the market correction depth.
Other financial instruments in the trade list may be also interesting, but in these markets pullback signals on the Daily timeframe are likely to occur no earlier than a week.
Good luck in trading!