
EUR/USD Long In Good Shape After US ISM Data
- ISM non-manufacturing activity fell to 51.4 from 55.5 the month before. That was well below expectations of 58.8. The reading was below median market expectations of 55.0.
- The business activity index fell to 51.8 from 59.3 the month before. That was well below expectations of 58.8. The declines in both the headline services and business activity indexes were the largest, in point terms, since November 2008 when the financial crisis was roiling the global economy.
- The employment index fell to 50.7 from 51.4 a month earlier. New orders dropped to 51.4 from 60.3. The prices paid index fell to 51.8 from 51.9.
- The US economy's manufacturing sector shrank in August, according to an earlier ISM report.
- Nonetheless, San Francisco Fed President John Williams said in prepared remarks late on Thursday that the economy was in "good shape" and that it "makes sense to get back to a pace of gradual rate increases, preferably sooner rather than later." Williams said he forecast unemployment, now at 4.9%, to fall to 4.5% in the coming year and inflation to rise to the Fed's 2% target in the next year or two.
- Longer-term, however, Williams made it clear he is far from comfortable with the Fed's current approach to monetary policy.
- Targeting low inflation, as the Fed and many other central banks currently do, simply will not work well in a world where economic growth and interest rates are likely to be persistently lower than they were in the era before the Great Recession, he said. A low inflation target, he said, gives the Fed too small a buffer to fend off future shocks.
- The Fed could raise its 2% inflation target to 3% or even 4%, or shift away from inflation targeting altogether and instead target a nominal level of national economic output, Williams said.
- Our EUR/USD long opened at 1.1150 is in good shape. The EUR/USD broke above daily cloud top at 1.1170 and 100-dma at 1.1212 after weaker-than-expected ISM reading. RSIs are biased up again. The nearest resistance levels are August 26 hourly high at 1.1282 and daily high at 1.1341.
USD/JPY Dropped As Weak US ISM Lowers Fed Hike Bets
- The Bank of Japan will conduct an assessment of its effect of stimulus programme when it holds next meeting September 20-21. According to the Sankei newspaper, there is a three-way split in the board over which policy strategy to follow.
- One group believes the central bank should focus on its negative interest rate policy to stimulate growth, another advocates more purchases of Japanese government bonds to inflate the economy, while a third group opposes further stimulus. BOJ Governor Haruhiko Kuroda is among those who support negative interest rates, according to the report.
- Earlier this week, Kuroda for the first time publicly acknowledged that negative rates could dampen public sentiment by hurting banks' profits and the rate of returns on pension investments. But he said monetary policy has yet to reach its limit, stressing that the BOJ had room to deepen negative rates.
- Concerns are rising that there must be limits to the BOJ's bond purchases, as the central bank already holds a third of the JGB market. The central bank now buys enough JGBs to keep the amount of bonds outstanding rising at a rate of around JPY 80 trillion annually.
- Earlier this month Governor Kikuo Iwata said the BOJ has no plans to reduce the amount of assets it buys or change the composition of assets it purchases in a way that would tighten monetary policy. Board members Takehiro Sato and Takahide Kiuchi oppose against more easing, arguing that it would cause unwanted side effects, like reducing banks' profit margins.
- The Bank of Japan will refrain from accelerating money printing or deepening negative rates this month as improvements in the economy make it hard to justify again deploying "bazooka"-like big stimulus, Kazuo Momma, who oversaw the bank's monetary policy drafting and global affairs until May, said. In his opinion the BOJ may consider making some "adjustments" to its asset purchases at the September 20-21 rate review if it needs to appease investors betting on action.
- The USD/JPY dropped strongly after yesterday’s US ISM data. In our opinion overall scope is for losses back below 100.00, which in turn will target June 99.00, August 99.55 lows. USD/JPY rises are stymied by the thick cloud which currently spans 103.73-105.23. We will consider getting short near 102.50.
AUD/USD: Australian GDP Growth Slightly Below Expectations
- The Australian economy expanded 0.5% in the June quarter of 2016, slowing from a downwardly revised 1.0% growth in the previous quarter and slightly below market consensus of a 0.6% growth. It was the weakest growth since the second quarter 2015, weighed down by net trade while investment was flat and final consumption remained steady.
- In the second quarter of 2016, final consumption expenditure grew by 0.8%, adding 0.6%age points to GDP growth. Household spending rose 0.4% while government expenditure increased by 1.9%. Gross fixed capital formation was flat. Private investment fell 3.4%, driven by a 12.4% drop in non-dwelling construction. Public investment rose 15.5%, largely due to a 21.0% increase in state and local general government. Exports of goods and services went up 1.3% while imports of goods and services grew at a faster 2.7%. Net exports detracted 0.2 percentage points from GDP growth. The change in total inventories was an increase of AUD 706 million in seasonally adjusted terms compared to a decrease of AUD 477 million in the December quarter, contributing 0.3 percentage points to GDP. This increase was driven by a rise in wholesale trade inventories.
- Main GDP price indicator up only 0.3 percent for the year. Low inflation could argue for the next rate cut. Financial markets now imply around a 44% chance of a further rate cut by Christmas. We think there will be no further monetary easing. That is why we keep our bullish long-term AUD/USD outlook.
FOREX - MAJOR PAIRS: 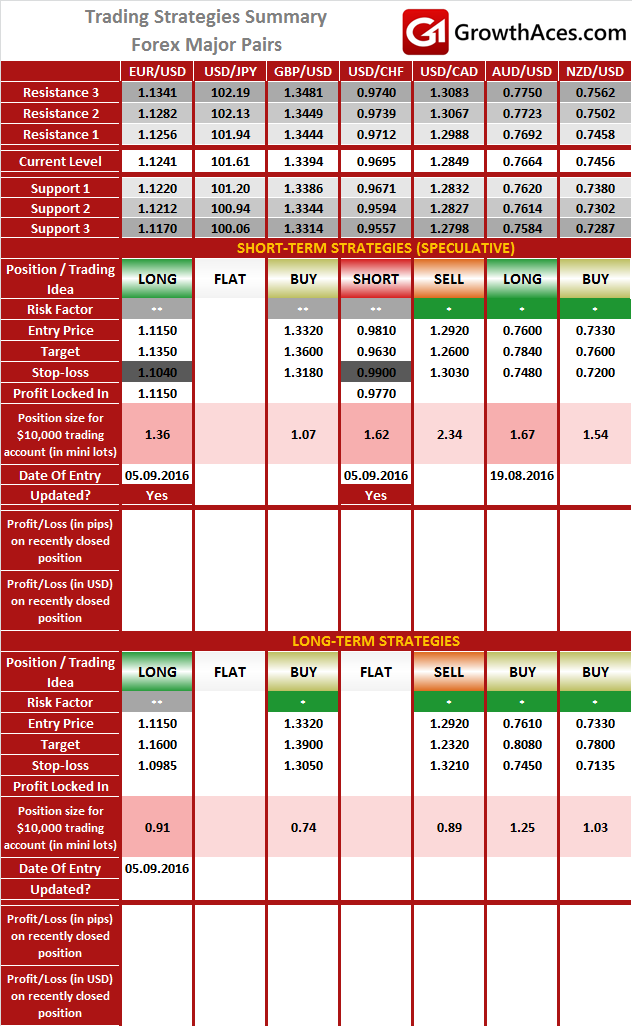
FOREX - MAJOR CROSSES: 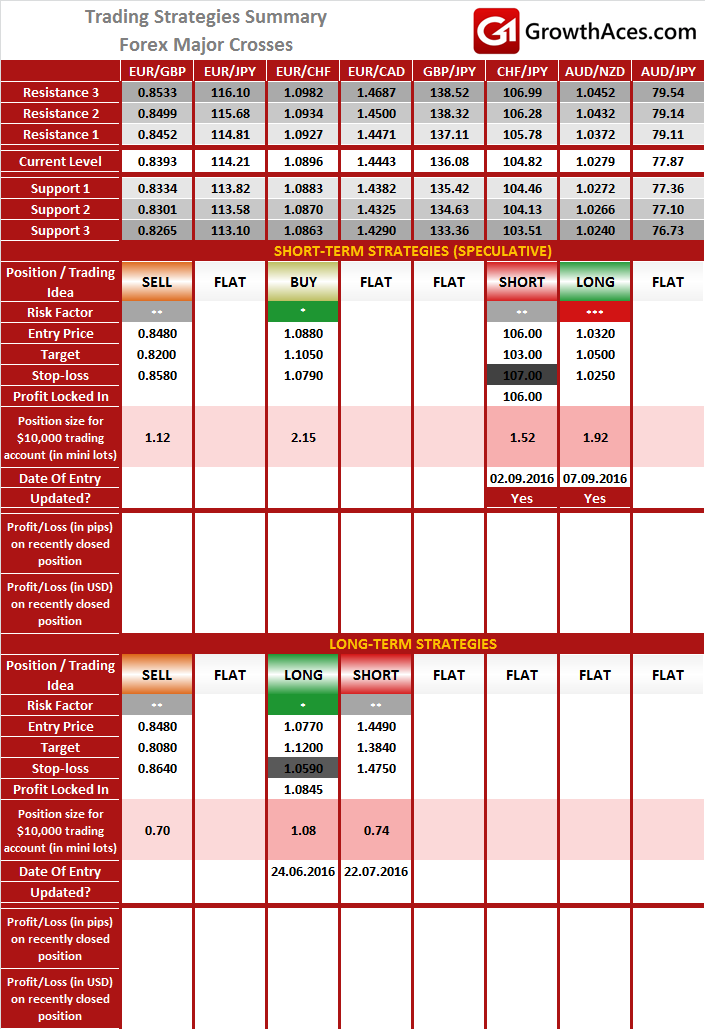
PRECIOUS METALS: 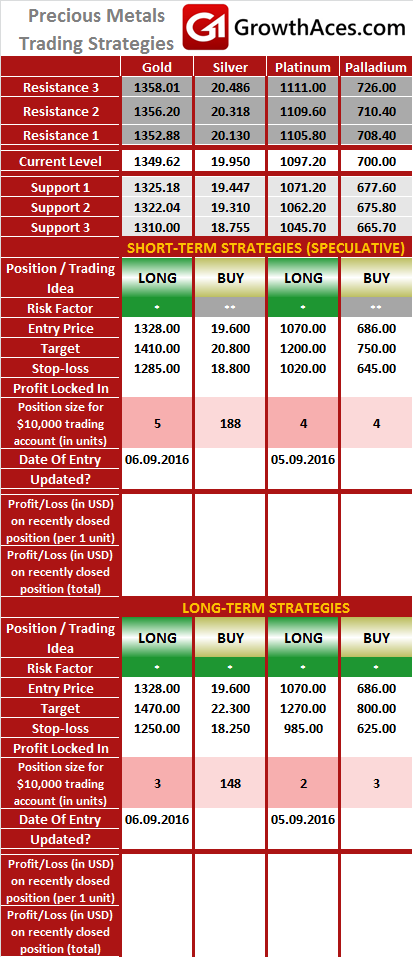
It is usually reasonable to divide your portfolio into two parts: the core investment part and the satellite speculative part. The core part is the one you would want to make profit with in the long term thanks to the long-term trend in price changes. Such an approach is a clear investment as you are bound to keep your position opened for a considerable amount of time in order to realize the profit. The speculative part is quite the contrary. You would open a speculative position with short-term gains in your mind and with the awareness that even though potentially more profitable than investments, speculation is also way more risky. In typical circumstances investments should account for 60-90% of your portfolio, the rest being speculative positions. This way, you may enjoy a possibly higher rate of return than in the case of putting all of your money into investment positions and at the same time you may not have to be afraid of severe losses in the short-term.
How to read these tables?
1. Support/Resistance - three closest important support/resistance levels
2. Position/Trading Idea:
BUY/SELL - It means we are looking to open LONG/SHORT position at the Entry Price. If the order is filled we will set the suggested Target and Stop-loss level.
LONG/SHORT - It means we have already taken this position at the Entry Price and expect the rate to go up/down to the Target level.
3. Stop-Loss/Profit Locked In - Sometimes we move the stop-loss level above (in case of LONG) or below (in case of SHORT) the Entry price. This means that we have locked in profit on this position.
4. Risk Factor - green "*" means high level of confidence (low level of uncertainty), grey "**" means medium level of confidence, red "***" means low level of confidence (high level of uncertainty)
5. Position Size (forex)- position size suggested for a USD 10,000 trading account in mini lots. You can calculate your position size as follows: (your account size in USD / USD 10,000) * (our position size). You should always round the result down. For example, if the result was 2.671, your position size should be 2 mini lots. This would be a great tool for your risk management!
Position size (precious metals) - position size suggested for a USD 10,000 trading account in units. You can calculate your position size as follows: (your account size in USD / USD 10,000) * (our position size).
6. Profit/Loss on recently closed position (forex) - is the amount of pips we have earned/lost on recently closed position. The amount in USD is calculated on the assumption of suggested position size for USD 10,000 trading account.
Profit/Loss on recently closed position (precious metals) - is profit/loss we have earned/lost per unit on recently closed position. The amount in USD is calculated on the assumption of suggested position size for USD 10,000 trading account.
Source: GrowthAces.com Daily Forex Signals