Downside risk is rising for stocks in emerging markets
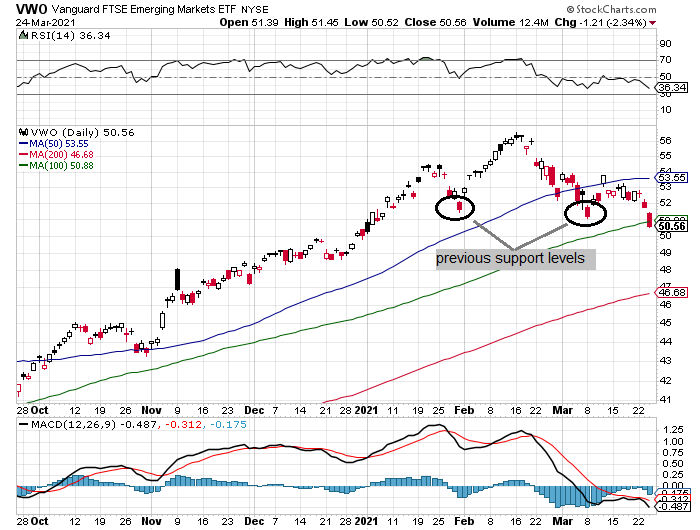
The downside support at roughly $51 didn’t hold for the Vanguard FTSE Emerging Markets Index Fund ETF Shares (NYSE:VWO), which closed below the two previous downdrafts in 2021. When the dust cleared, VWO ended yesterday's session at the lowest close since Jan. 4.
The moving averages still reflecting an upward bias, but Wednesday's decline opens the possibility that the tide is turning. Not only did VWO close below the two previous troughs, it broke below its 100-day moving average for the first time since last June.
This could all be noise, of course, and so it’s premature to draw conclusions at this point. But after a stellar run from last year’s bottom, investors with outsized allocations to EM stocks may want to take some profits.
One of the headwinds in this space is rising US interest rates, a shift that’s creating new challenges for developing countries in need of fresh borrowing to juice their economies in the wake of the macro blowback unleashed by the pandemic.
It’s debatable if US rates will continue to rise, but the crowd is erring on the side of caution by discounting, at least moderately, what appears to be an increasingly uncertain future for EM stocks overall.

Are global shares ex-US poised to outperform?
US shares have bested foreign stocks for years, but there have been periods when it looked like a leadership change was in the offing. False dawns, it turned out. Is this time different?
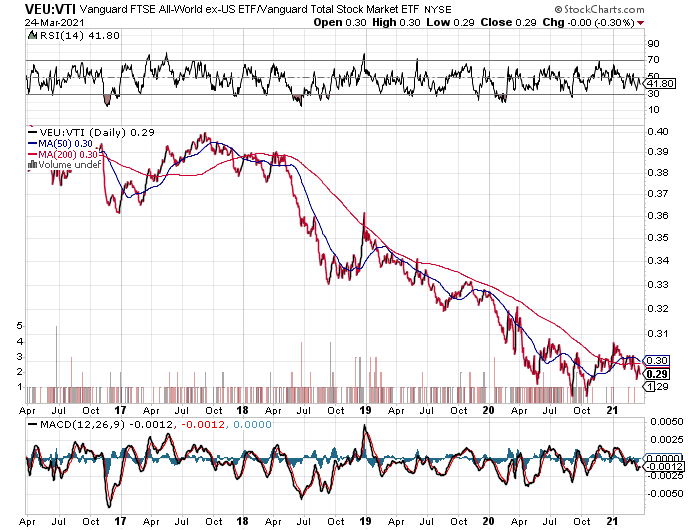
It’s a topical discussion of late after seeing the ratio index for Vanguard FTSE All-World ex-US Index Fund ETF Shares (NYSE:VEU)/Vanguard Total Stock Market ETF Shares (NYSE:VTI) pop higher lately. Notably, this index’s 50-day average rose above its 200-day average for most of 2021, and remains so through yesterday's close—a sign of relative strength for VEU.
This year marks the first time this ratio index’s 50-day average has been above the 200-day average since late 2017. Encouraging, or so it seems. But the performance of VEU vs. VTI, however, has stumbled recently.
If the VEU:VTI ratio stumbles further in the days/weeks ahead, dragging the 50-day average below the 200-day average, it may be time to put another fork in the notion that foreign stocks writ large are poised to outperform the US.

Palladium’s bull run looks irrepressible
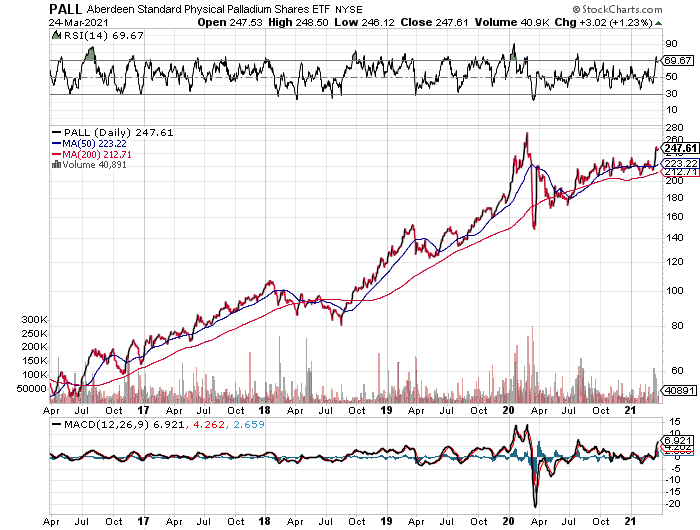
With most asset classes (and sub-asset classes) stumbling lately, Aberdeen Standard Physical Palladium Shares ETF (NYSE:PALL) is a rare outlier. Rising 1.2% on Wednesday, the gain lifted the fund closer to its February 2020 record high. Although that peak is still a ways off, PALL is on the short list for ETF assets exhibiting seemingly unstoppable persistence to run higher.
As noted by FXStreet:
“Platinum and palladium have surged in recent weeks. As the global economic recovery continues and global pollution standards tighten, the recent mine site disruptions suggest hefty deficits and a path toward $3,000/oz for palladium and $1,350/oz for platinum over the next twelve months, strategists at TD Securities report.”

