
After an impressive string of five consecutive monthly gains, during which the venerable S&P 500 gained an eye-popping 1,060.55 points (or +25.3%) during the November through March period, it now appears that the bears are finally (as in FINALLY!) making an attempt to get back in the game.
It looks like the raison d'etre for the sudden market weakness is an oldie but a goody: premature pivot positioning. In other words, prior to the start of April, stock and bond traders had once again priced in expectations for the Fed to switch gears and move to a more friendly stance - and soon. The history of what happens to the stock market after the Fed moves to an "easing" cycle from a "tightening" cycle is well documented. In short, stocks tend to romp higher in the ensuing year - especially if the economy can avoid a recession in the meantime.
As I've opined a time or two recently, we believed the market's recent joyride to the upside was due in large part to (a) the economy doing just fine, thank you, (b) inflation trending in the right direction, and (c)traders "pulling forward" the gains that were surely to come once the Fed pivoted. Remember, everybody on the planet knows that the old saw, "Don't Fight the Fed" was about to become applicable - this time in a good way. As such, investors of all shapes and sizes wanted to jump on this bandwagon early in order to participate in those sure-to-be "no brainer" gains.
Even with the economy looking "stronger for longer" in the first quarter, stocks were able to stay in an uptrend. Despite traders coming to grips with the idea that the Fed was more likely to cut rates three times instead of the previously assumed six, the S&P 500 continued to march steadily higher. The trend (as well as a little thing called FOMO) became so entrenched that the blue-chip index moved lower for three consecutive days only once - and that was during the first three days of the year.
To be sure, the enthusiasm around AI and the earnings from the likes of Nvidia (NASDAQ:NVDA) - whose earnings continue to confound our furry friends in the bear camp - certainly helped. Don't look now fans, but everybody's favorite AI chipmaker gained more than 80% during the first quarter of 2024. And the AI bulls tell us there is more where that came from as the valuation of Jensen Huang's company is reportedly lower than it was five years ago, and I'm told that NVDA's forward P/E is currently lower than GE's.
Trees Don't Grow To The Sky
But, but, but... It is important to remember that even if we are in the early innings of the AI growth game, stocks rarely move in a straight line - well, except for the first quarter of 2024, of course. Usually, once a theme takes hold and the bulls really get on a roll, something comes along to produce a pothole on the road to higher prices.
Wall Street also has a habit of overdoing E-V-E-R-Y-T-H-I-N-G. So, at some point, it is generally inevitable that a pullback, a correction, or a sloppy period will take hold. And from my seat, the premature pivot positioning theme may be just that - for now, anyway.
Not Surprising
Experience teaches that even the best uptrends wind up looking like a two-steps-forward-and-one-step-back pattern on the charts over time. So, with stocks having enjoyed one heck of a ride over the last five months, a pullback, a correction, a sloppy period, or even a pause-that-refreshes should be considered to be par for the course.
It is for this reason that I keep a group of indicators/models designed to suggest when the market may be ripe for a reversal on a short-term basis. Below is the state of what I call my "Early Warning Indicator Board" as of Monday evening.
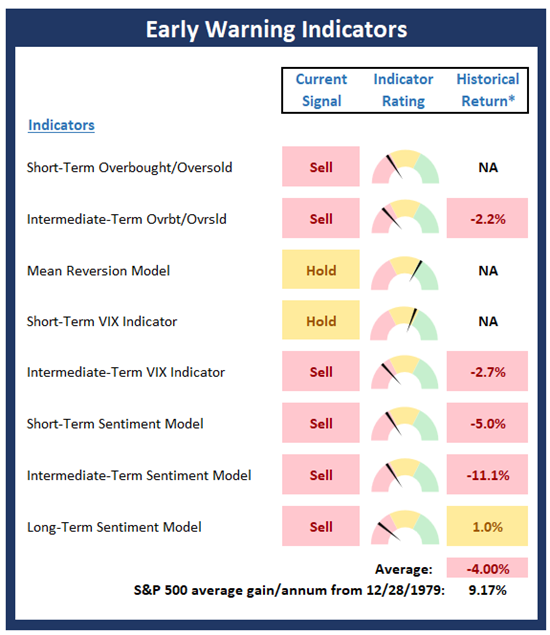
Based on proprietary indicators. Not trading advice.
See all that red? To me, this indicator board was acting like the kid in the back of the classroom who knows the answer to the question and is wildly waving his/her arm to get the teacher's attention.
In short, stocks had become super-overbought, investor sentiment had become too exuberant, and the volatility indicators suggested that traders had become too complacent. And when these conditions happen - especially when they happen all at once - it is usually a decent bet that a "countertrend" move is likely to happen in the near term.
Staying Power?
So for me, the question of the day wasn't IF the bears were going to enjoy some time in the sun soon, but rather whether or not their reasons for doing some selling will have staying power.
While we can never know for sure how long the sellers will hold sway, my take is that yet another bout of pivot positioning could take a while, (between a few days and a couple weeks). However, since this concept isn't exactly new and the trend/momentum of the market has been strong, I for one will be giving the bulls the benefit of the doubt here.
***
Disclosures: At the time of publication, Mr. Moenning held long positions in the following securities mentioned: NVDA - Note that positions may change at any time.