Here are the latest developments in global markets:
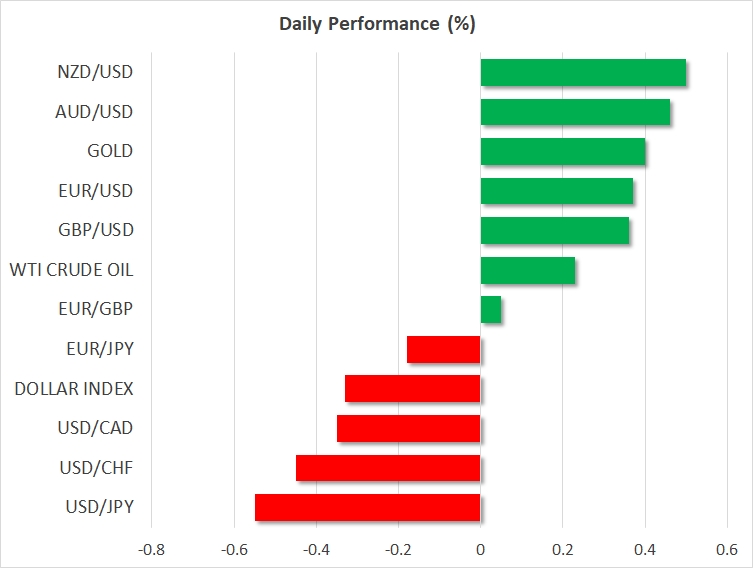
- FOREX: The dollar’s index against a basket of currencies headed lower, touching its lowest in nearly a month, as the greenback was hurt by falling long-term Treasury yields.
- STOCKS: The Japanese Nikkei 225 lost 0.6% and Hong Kong’s Hang Seng was up by 0.7%. Euro Stoxx 50 futures traded down by 0.1% at 0731 GMT, while Dow, S&P 500 and NASDAQ 100 contracts were all up by around 0.1%.
- COMMODITIES: WTI and Brent crude edged higher, though their gains were limited. They both traded not far below the 2-½-year high levels tracked earlier in the week. WTI was at $59.78 per barrel and Brent at $66.62. Dollar-denominated gold continued gaining on the back of the US currency’s weakness. The precious metal was up by 0.4% at $1,291.62 an ounce, trading not far below a one-month high recorded earlier in the day. Copper was posting notable gains.
Major movers: Dollar on negative footing as yields decline; rival currencies record multi-week highs versus US currency
The dollar index was 0.3% down at 92.72 after earlier touching 92.70, its lowest since December 1. Falling long-term yields were rendering the US currency less attractive relative to other currencies. Ten-year Treasury yields stood at 2.43% as European traders were beginning their trading day. This compares to last week’s 2.50%, the highest level since late March.
Dollar/yen was 0.6% down at 112.71, trading at eight-day low levels. During Asian trading, Japan saw the release of data on November industrial production and retail sales, with both releases – most notably the latter – coming in above expectations.
As an additional indication of dollar weakness: euro/dollar was 0.4% up at 1.1931, trading near the day’s high of 1.1936, this being the pair’s highest since December 1. Pound/dollar was 0.4% up at 1.3444, not far below a two-week high recorded earlier in the day.
Commodity-linked currencies that were posting gains in previous days on the back of rising metal and oil prices, continued advancing versus the US dollar. Dollar/loonie was 0.4% down at 1.2608, just a shade above its lowest since late October hit earlier today. Aussie/dollar and kiwi/dollar were up by 0.4% and 0.5%, at 0.7802 and 0.7093 respectively, both hitting fresh multi-week highs relative to the greenback during today’s trading.
Day ahead: Dollar awaits initial jobless claims and Chicago PMI; EIA crude oil report pending
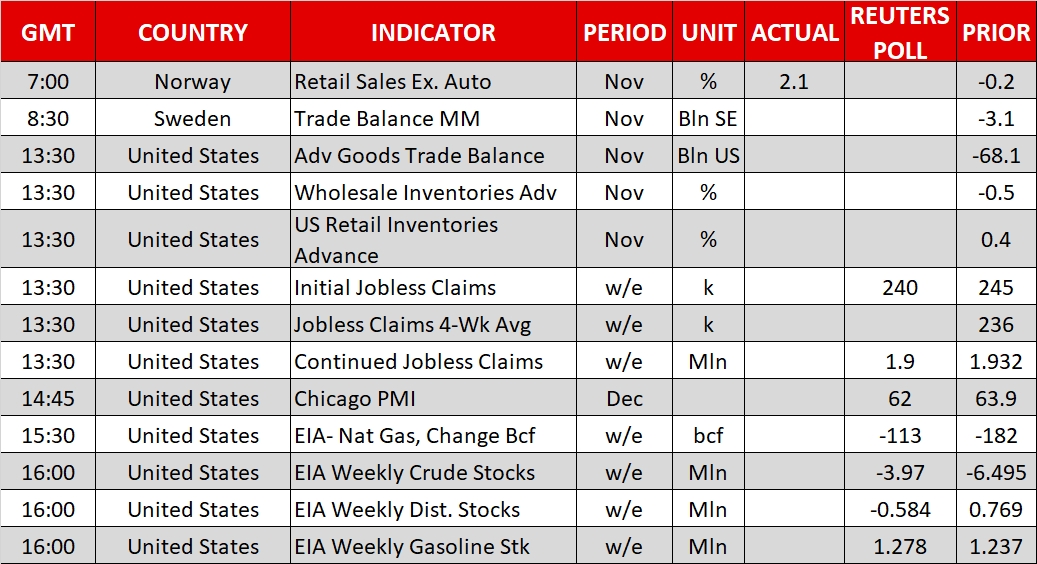
The dollar will be in the spotlight on Thursday as several economic releases out of the US have the potential to move the currency.
The first report to attract attention will be delivered at 1330 GMT and will involve initial jobless claims for the week ending December 22. The number of people applying for unemployment benefits for the first time is expected to fall by 5,000 to 240,000 in the aforementioned period, probably adding some gains to the dollar if the figure comes in lower than forecasted.
Meanwhile, preliminary readings on US wholesale and retail inventories, as well as stats on the goods trade balance for the month of November will be available along with the above labor data.
Following at 1445 GMT, the Chicago PMI which tracks business activities in the city of Chicago is expected to retreat by 1.9 points in December to 62.0.
In energy markets, investors will be looking forward to the EIA weekly crude oil report due at 1600 GMT. After reaching the deepest fall in three months of 6.495 million barrels, forecasts are now for US crude stocks to decline by 3.970m barrels in the week ending December 22. If indeed the case, this would be the sixth consecutive week of declines and would likely push oil prices higher if crude inventories decrease more than anticipated. The report’s information on gasoline and distillate stocks will also be of interest.
Technical analysis – USD/JPY falls sharply but neutral bias still in place
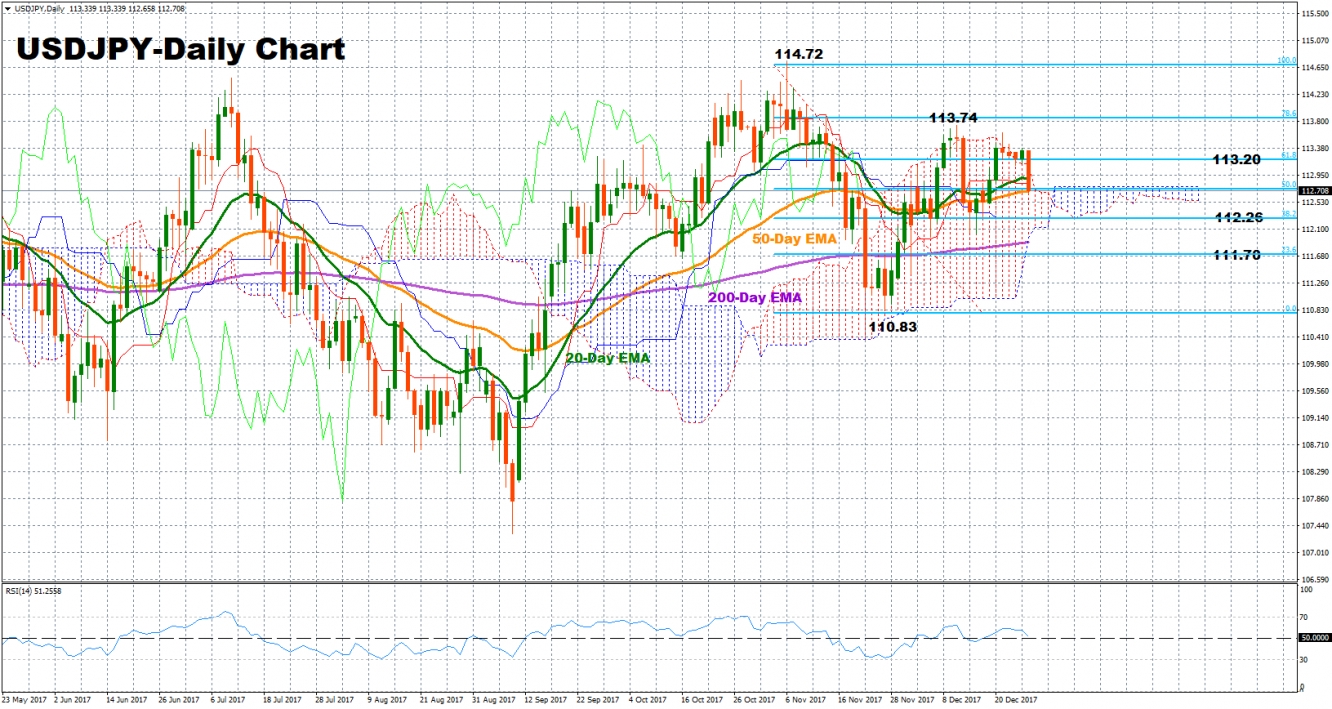
USD/JPY took a knock from lower US Treasury yields, diving to the 112 area and giving back earlier gains. However, the pair remains neutral in the short-term; a fall below the 38.2% Fibonacci of 112.26 of the downleg from 114.72 to 110.83 would indicate the start of bearish phase. Moreover, the RSI is currently close to its neutral level (50), suggesting that prices might move sideways in the near-term.
Below the 38.2% Fibonacci mark, additional support levels could be found at the 200-day exponential moving average at 111.90. Further downside movements from here would target the 23.6% Fibonacci at 111.70 and the swing low at 110.83.
If on the other hand, prices head up, the 20-day EMA at 112.89 could act as resistance. Any break above of this point would shift the focus to the 61.8% Fibonacci at 113.20 and to the previous top of 113.74. The 114 key-area could also act as a barrier to upside movements.


