The five macro trends set to define 2026
Taking a look at the intra-day swings that the Robots use to whack you out of your trades with a loss
Most active traders should be aware by now that some 80% of the daily volume in the various trading exchanges is by what is called “programmed” trading. Some call it Bot’s, Robots, Algo programs, or other not so nice names. They are here to stay and you need to learn what a Robot type move looks like both up or down. If you can learn to spot some of the typical moves up or down, you can profit both on the selling and the buying and better time your entries.
I am sure we have all experienced a feeling of disbelief when you watch one of your swing trade stocks suddenly turn about face on massive volume and seemingly plummet in the course of minutes or 20-30 minutes right? This is classic Algo trading programs and once you can spot them you are less likely to panic, and more likely to add to your position and grab the reversal back to the upside.
For sure, it helps to fully understand the fundamentals behind the company/stock that you are trading if at all possible, as that will also tend to prevent you from over reacting on the downside.
I use a 10 minute chart in real time, and certain technical indicators to help me follow the intra-day swings and try to better time my entries and exits.
Lets take a look at a few stocks that today broke out at the open, gapped up, ran hard… then seemingly turned down without notice and with no news… a typical BOT trade pattern:
In this 10 minute chart, you can see the extreme high at 56.20, and about 1 hour and 20 minute later back down to 54.60 from 56.20. At these extremes a day swing trader is taking those profits, and then waiting for the robots to complete the sell off and stop loss runs, and then SLOWLY entering or what we call “SCALING IN” as the stock bases a bit. (see the light blue line at bottom of chart around 54.50)
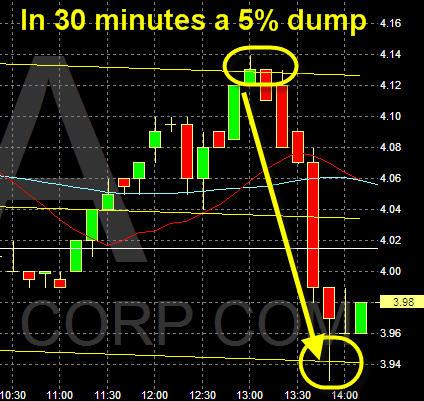
Here is another one.. broke out at the open ran to 4.12 ranges, and then in 30 minutes with massive volume dumped to 3.93 for a 5% drop. Again, you could have exited out at the extreme indicator then looked to re-enter at the oversold indicator and Robot dumping ground:

So the key here is be aware of those Robots coming at you with the Hummer vehicle ready to run your position over. Be aware of “gaps” in the chart and when you see an extreme overbought condition on the daily chart, wait for that Robot truck to show up and run the stock back down towards those gaps before you get caught chasing.
Most active traders should be aware by now that some 80% of the daily volume in the various trading exchanges is by what is called “programmed” trading. Some call it Bot’s, Robots, Algo programs, or other not so nice names. They are here to stay and you need to learn what a Robot type move looks like both up or down. If you can learn to spot some of the typical moves up or down, you can profit both on the selling and the buying and better time your entries.
I am sure we have all experienced a feeling of disbelief when you watch one of your swing trade stocks suddenly turn about face on massive volume and seemingly plummet in the course of minutes or 20-30 minutes right? This is classic Algo trading programs and once you can spot them you are less likely to panic, and more likely to add to your position and grab the reversal back to the upside.
For sure, it helps to fully understand the fundamentals behind the company/stock that you are trading if at all possible, as that will also tend to prevent you from over reacting on the downside.
I use a 10 minute chart in real time, and certain technical indicators to help me follow the intra-day swings and try to better time my entries and exits.
Lets take a look at a few stocks that today broke out at the open, gapped up, ran hard… then seemingly turned down without notice and with no news… a typical BOT trade pattern:
In this 10 minute chart, you can see the extreme high at 56.20, and about 1 hour and 20 minute later back down to 54.60 from 56.20. At these extremes a day swing trader is taking those profits, and then waiting for the robots to complete the sell off and stop loss runs, and then SLOWLY entering or what we call “SCALING IN” as the stock bases a bit. (see the light blue line at bottom of chart around 54.50)
Here is another one.. broke out at the open ran to 4.12 ranges, and then in 30 minutes with massive volume dumped to 3.93 for a 5% drop. Again, you could have exited out at the extreme indicator then looked to re-enter at the oversold indicator and Robot dumping ground:

So the key here is be aware of those Robots coming at you with the Hummer vehicle ready to run your position over. Be aware of “gaps” in the chart and when you see an extreme overbought condition on the daily chart, wait for that Robot truck to show up and run the stock back down towards those gaps before you get caught chasing.
