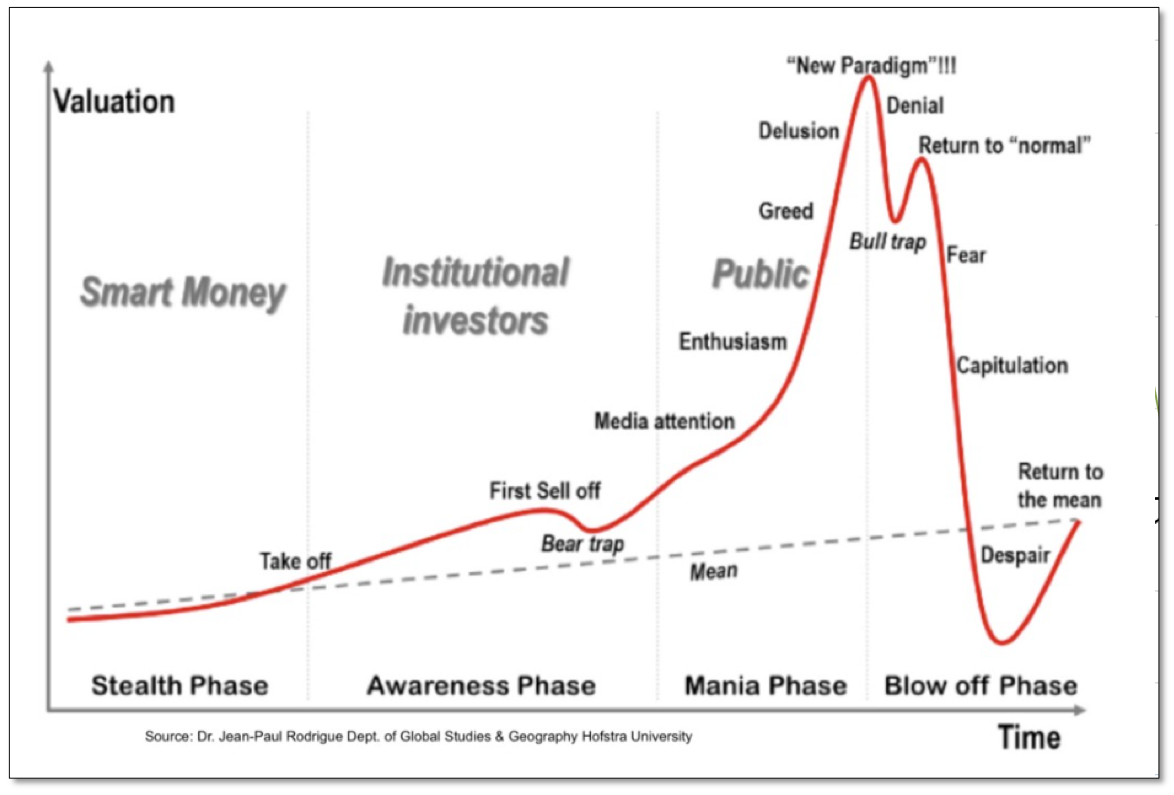
Found the nugget below waiting for me when I checked in on Twitter last week (red highlight his own). Granted, with the degree of contemporaneous thoughts now swirling freely around social media, it doesn’t take much to see a variety of outlooks contrary to your own. In many ways, this is the greatest value of the medium to traders – both from a behavioral point-of-view, as well as keeping abreast to a wide range of perspectives and insights potentially variant to your own thinking or market posture.
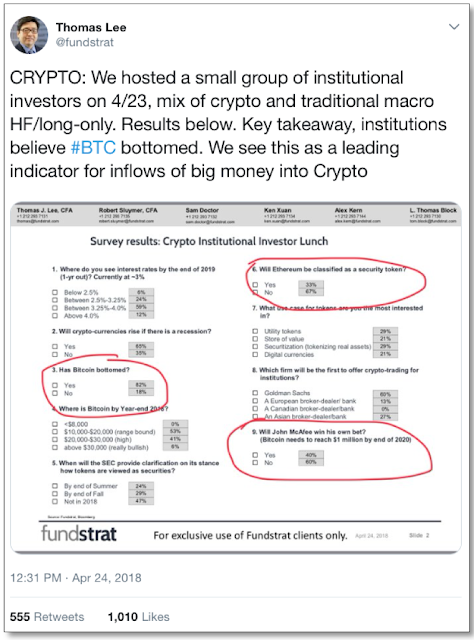
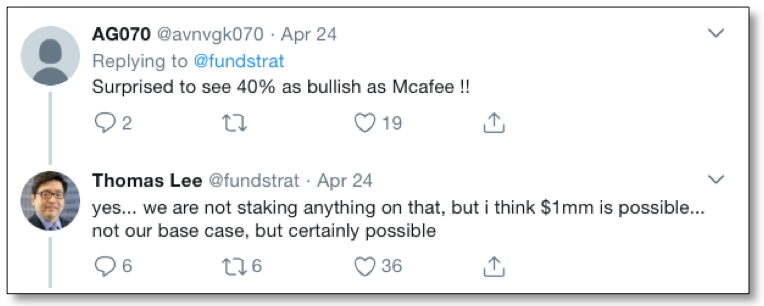
Variant indeed, as Tom Lee – who gained notoriety as a strategist for JP Morgan in the early part of the decade by rightfully remaining uber-bullish towards stocks through a variety of headwinds, now expects his long-term love affair with Bitcoin to weather this year’s turbulence as well. Taking his cue from “a small group of institutional investors” last week, Lee sees conditions developing where the strong hands of institutional demand resurrects the crypto markets from the smoldering ashes of largely retail speculators parabolic breakdown. Ignoring the fact that he appears to have the flow chart backwards – where institutional money typically sells the bag to retail investors right before the bottom falls out, the survey results capture the blind optimism that Lee has largely built his reputation on.
Has Bitcoin bottomed? Four-to-one say yes. Will Bitcoin close the year higher than where it is today? Unanimously certain. Will cryptocurrencies rise even if there is a recession? Two-to-one say yes. And my own personal favorite – will John McAfee win his notorious bet? For those unfamiliar with McAfee’s cringing embrace of the virtues of Bitcoin, or his revolting wager that Bitcoin reaches $1 million by 2020, less he consume his manhood… Forty percent of Lee’s survey also agrees. Sure, why not. What’s another 110 fold from here – it did it over the past two years.
We’ve commented in previous notes that from our perspective we view Bitcoin as nothing more than a distilled and supercharged speculative vehicle of the current asset market cycle. And while traders have ballooned the market caps of various cryptocurrencies over the past year, ultimately, their intrinsic value is still very much up for debate. Consequently, one could argue the risk is largely indefinite, hence the unprecedented risk/reward characteristics the markets have displayed.
From a behavioral perspective, we view the crypto markets as simply the higher beta proxies for riskier assets like equities, as Bitcoin expressed a strengthening positive correlation (+.90 weekly) with the S&P 500 over the past year and into their respective cyclical highs. Although the long-term intermarket relationships between stocks and Bitcoin is largely unknown at this point, our best educated guess would be they will continue to trend together over an intermediate timeframe – through good times and bad.
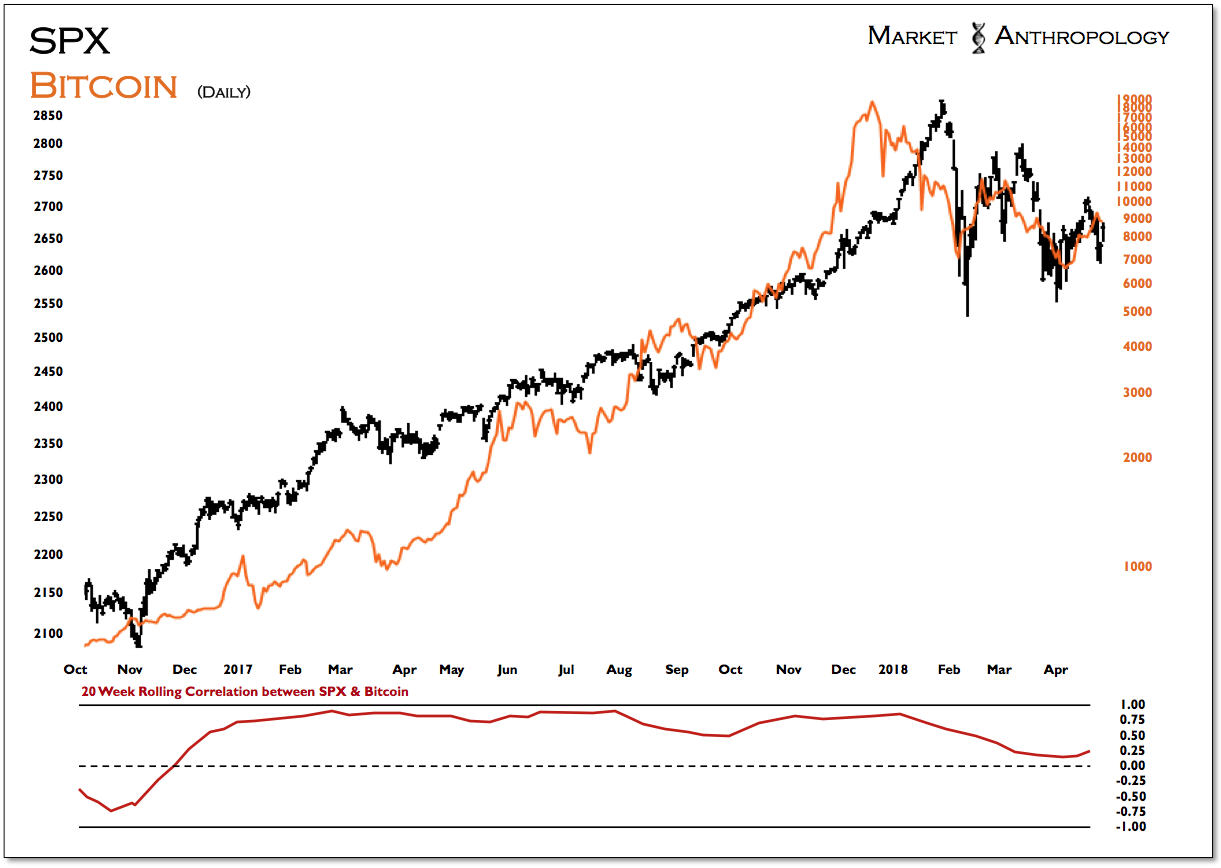
Speaking of which, both markets currently remain in limbo, caught between either a resumption of upside momentum or a breakdown below the previous lows. We remain firmly in the camp that has viewed the sequential parabolic breakdowns in both markets as a culmination of riskier assets final exhaustion trend. Keeping it simple, we reiterate our thoughts from earlier this year (see here).
"This is largely because of the inherent nature of parabolic trends, in that once the spell of a buying mania has broken, the unbridled chase that had carried the market without pause beyond more typical expectations, can not rekindle the same degree of momentum required to reestablish the uptrend. Eventually, through the markets subsequent failures to reestablish upside momentum with higher-highs, larger and more sophisticated capital looses trust and sells, thus reinforcing the markets now negative trading dynamics."
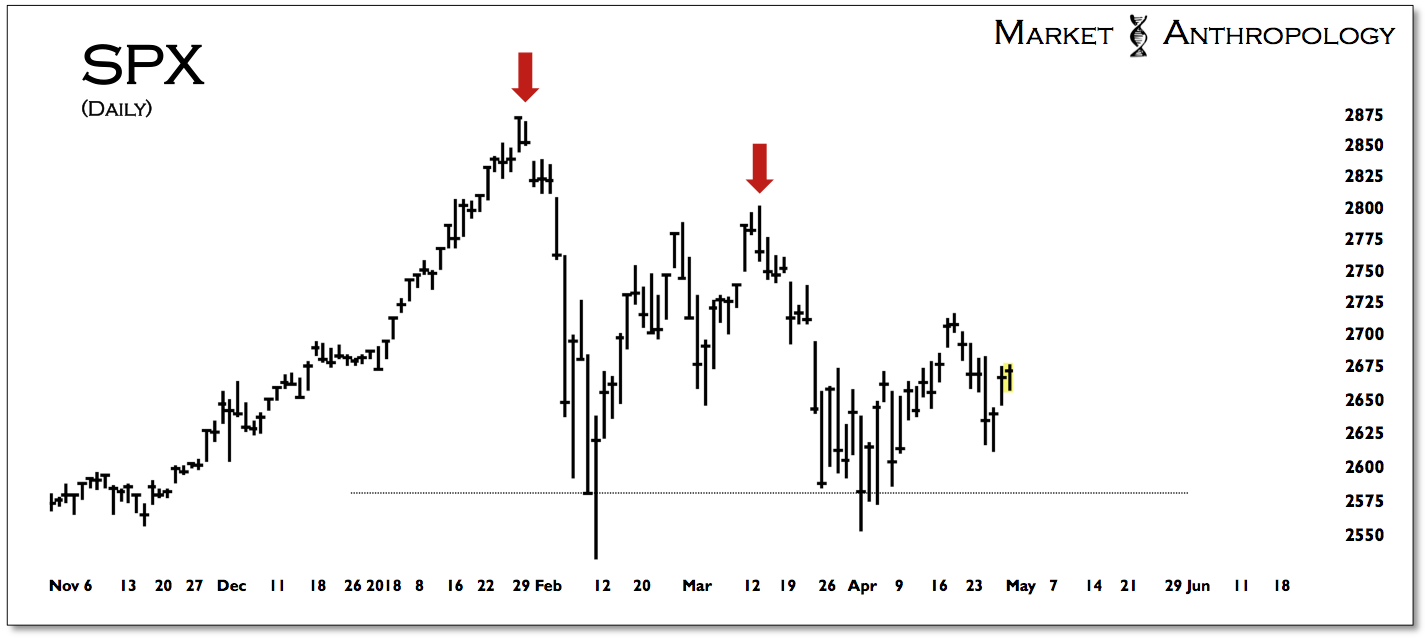
Along these lines, we’d argue that equity bulls had an opportunity with a V-shaped low in February to reestablish the bullish character within the equity markets headed into this year. As mentioned above, with each successively lower high, underlying market psychology becomes at risk of transitioning from a “return to normal” mentality – to fear. Technically speaking, we’d speculate that this shift would be achieved once the previous lows from February and April were broken.
What’s interesting to note, is that from an intermarket perspective, both long-term Treasuries (2016) and the US dollar index (2017) broke down from their respective cyclical highs in similar fashion. Last year we had used the pattern in bonds from 2016 as a leading guide for what we anticipated would be a cyclical breakdown in the dollar in 2017 (see here). Similar to the descending triangle pattern in bonds that broke down in the fall of 2016, the dollar continued to make successively lower highs until the market succumbed below previous lows with a larger retracement move last spring.
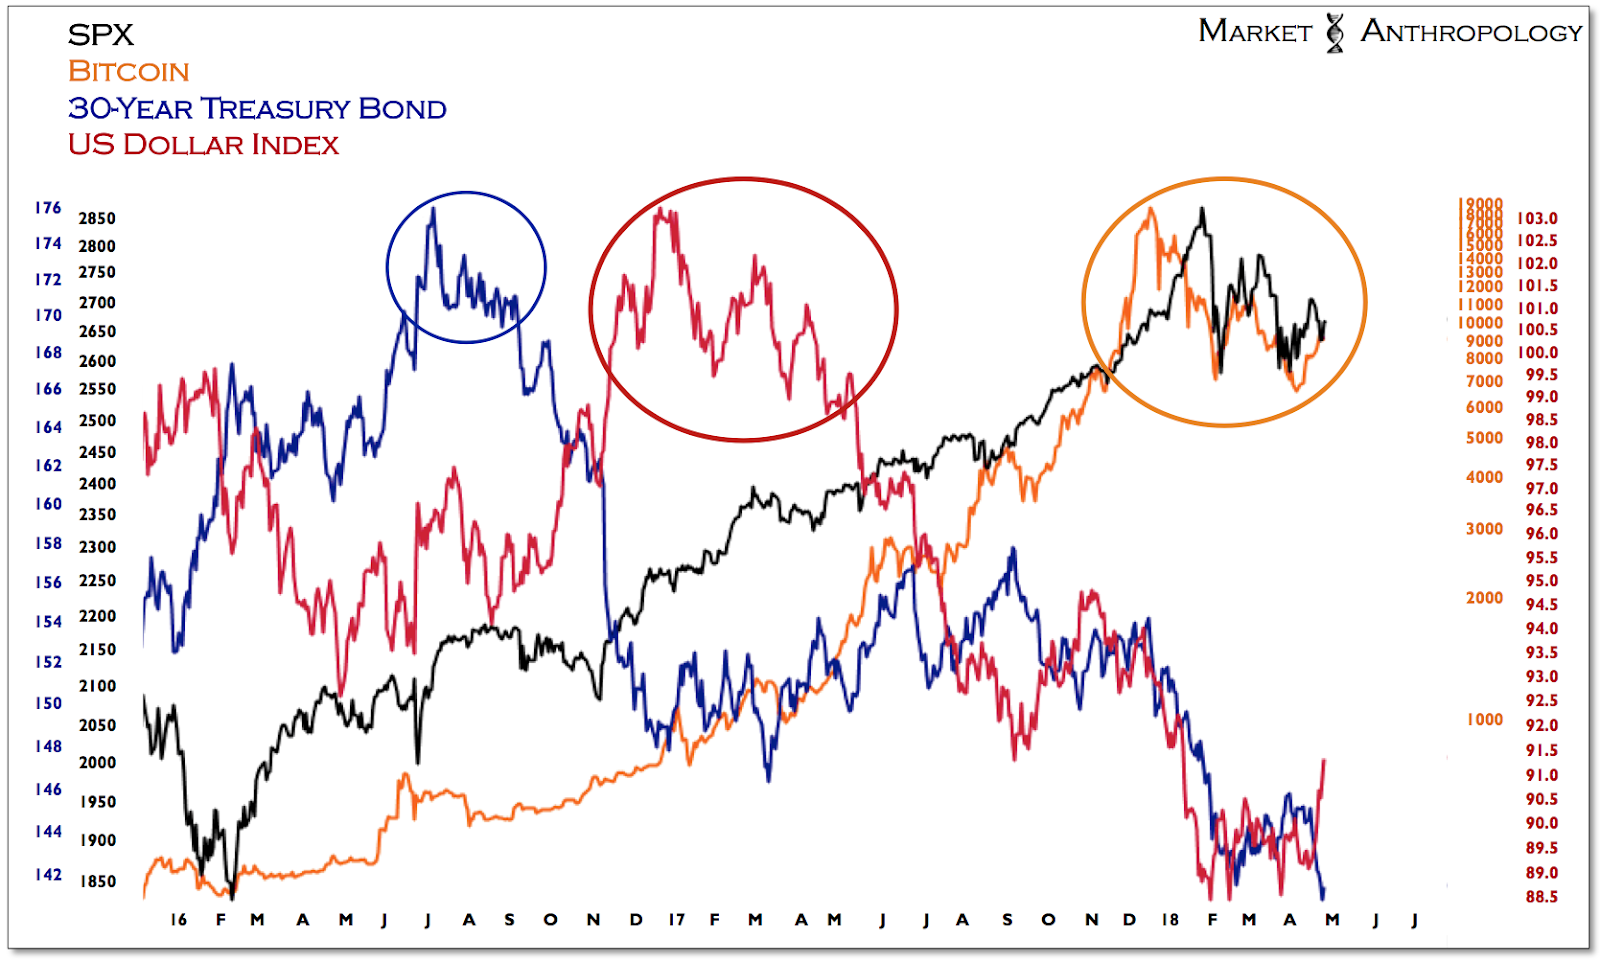
Should riskier assets like Bitcoin and equities continue to follow the two previous cyclical pivots in long-term Treasuries and the US dollar, it would be a remarkable sequence of underlying market psychology replicating similar behavioral patterns across the very largest asset classes in the world. While cryptocurrencies comprise a small fraction when compared to the size of other asset classes, we feel the relevance of their historic performance chase and breakdown at the pole position of the current asset cycle is significant.
Moreover, we’d speculate it’s suggestive of a more broader underlying market psychology that has transitioned through the late-stage manic and delusional phase towards a Minsky moment of sorts. The relative absence of fundamental underpinnings that typically serve as touchstone catalysts should concern Bitcoin bulls – and by extension those that trade riskier assets like stocks, as the market has displayed diminishing momentum traits with successively lower highs from the parabolic blow-off top last year.
Taking a quick peak around at other markets, we’re drawn to the set-ups in long-term Treasuries that remain flirting around long-term trend line support. As mentioned in previous notes, we’ve viewed both the 30-year Treasury bond within this technical window – as well as the 10-year yield up around 3 percent, as a bullish tactical opportunity to buy long-term Treasuries. Considering speculators have accumulated their largest short positions in history, the market is also attractive from a traditional contrarian perspective.
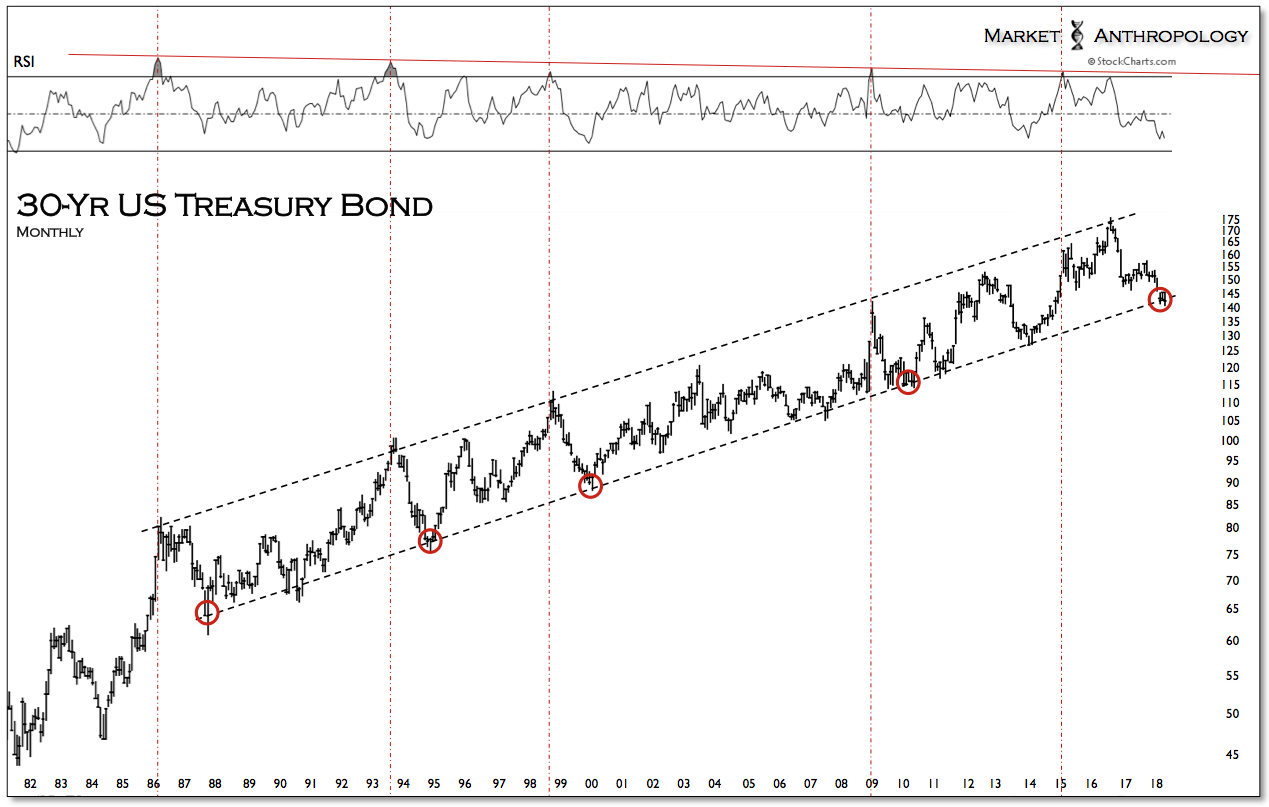
Connecting the dots to what this might imply about underlying macro conditions, it supports our suspicions highlighted in last months note (see here) that inflationary pressures may have reached an interim high and expectations towards the threat of more pernicious price conditions are now offsides. Our suggestions from last month stand: to watch for gold to trade around its previous cycle high without a strong and lasting continuation – for further indication of a potential shift in inflationary pressures and a further extension of gold’s consolidation range.
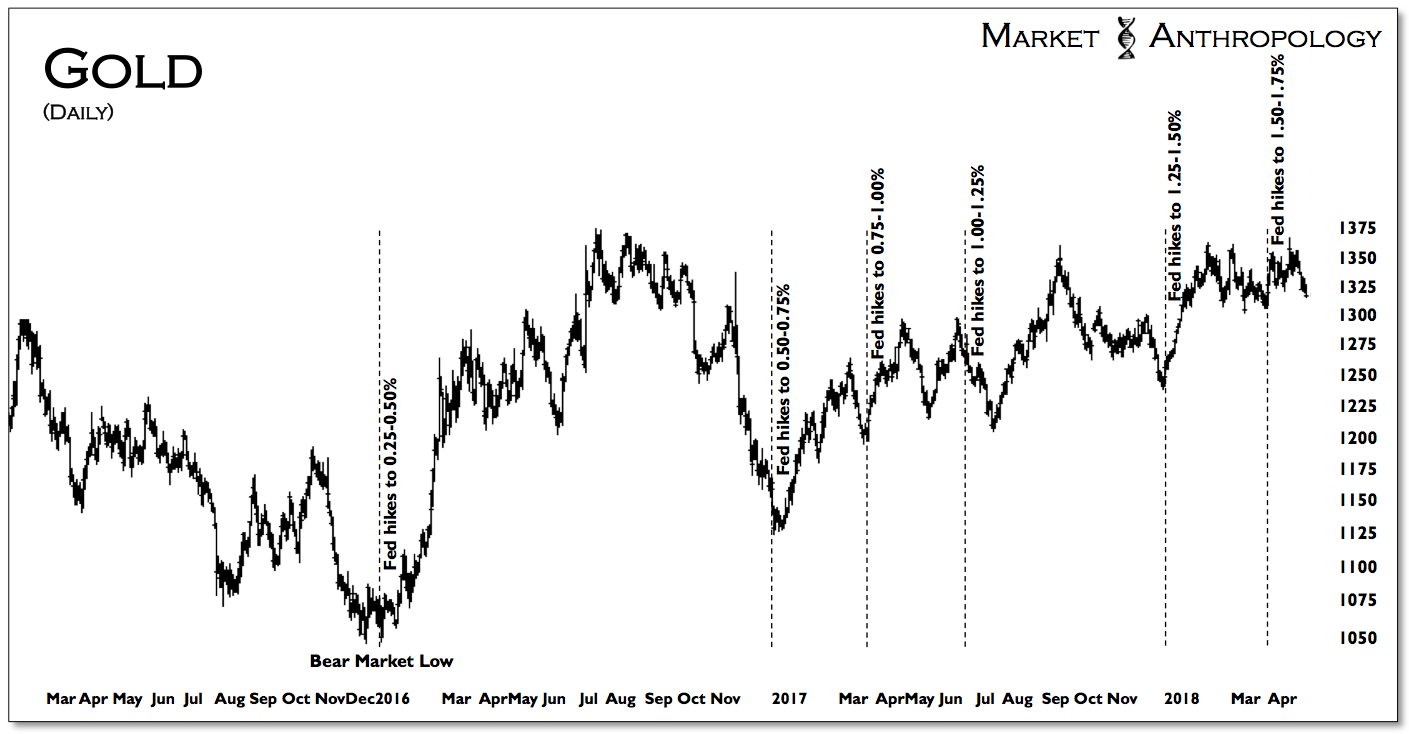
Moreover, the silver:gold ratio continues to languish, which in the past has indicated diminishing inflationary pressures, as shown below by the overlay with the Fed’s preferred benchmark of core PCE.
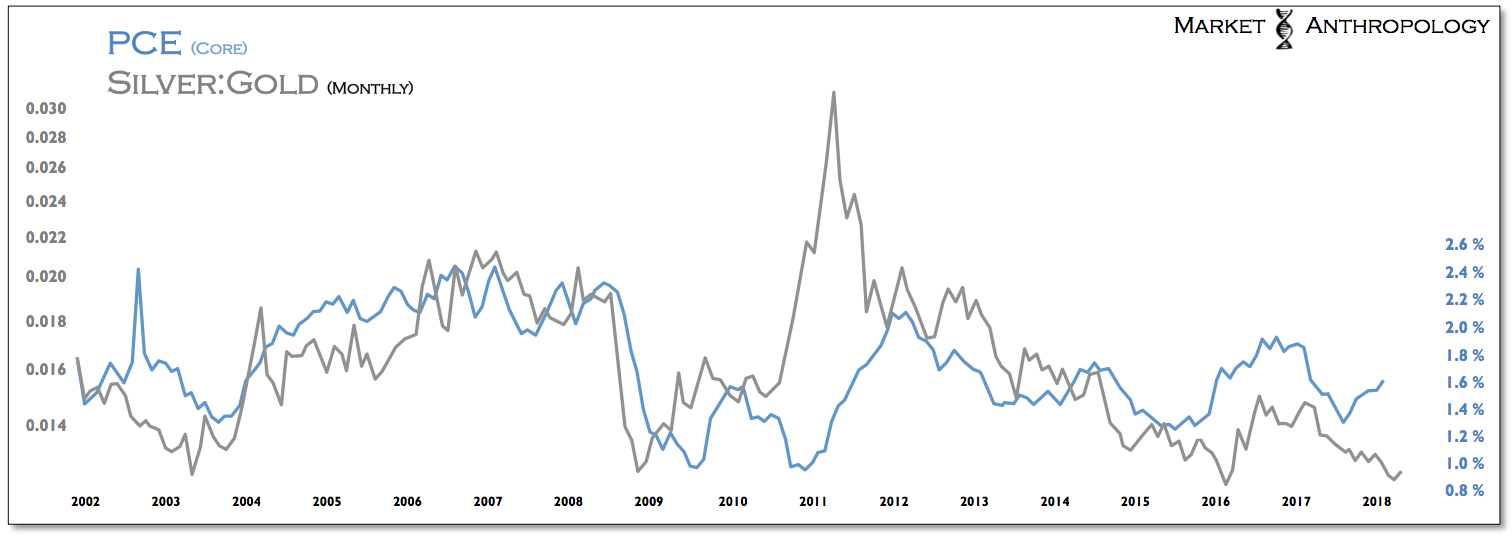
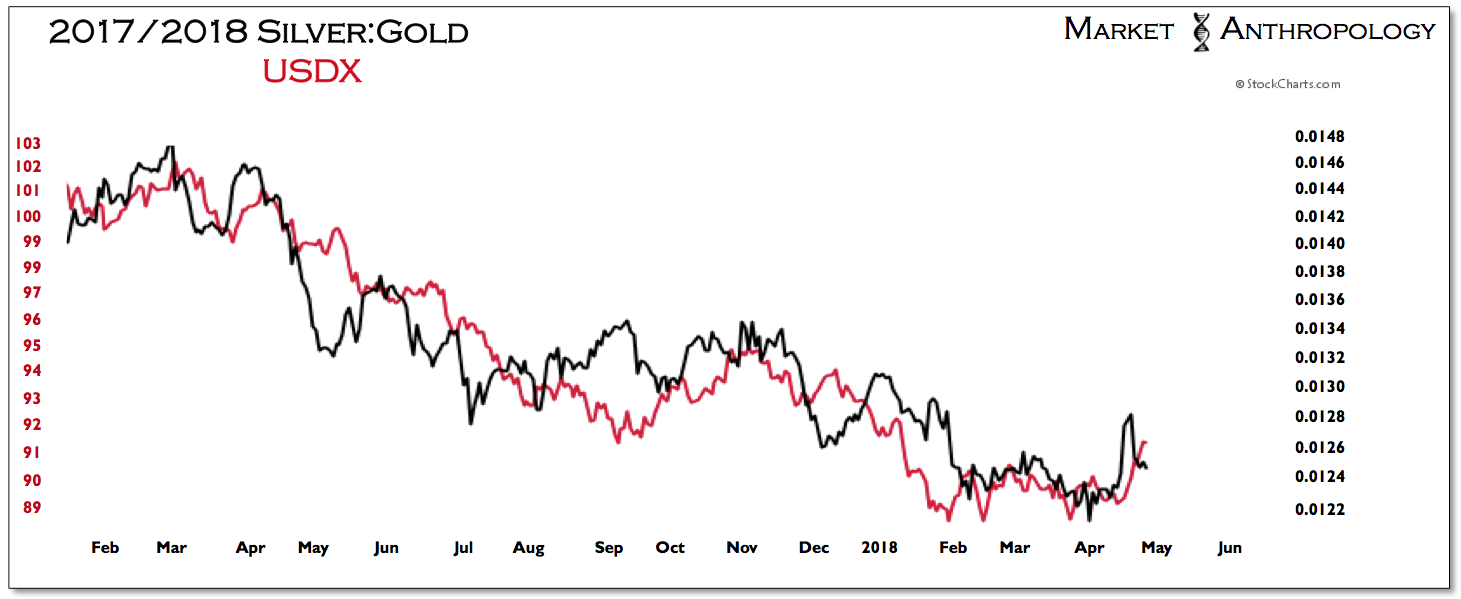
We are also following the US dollar index relative to the silver:gold ratio, which have been trending lower together over the past year. What’s interesting to note is the dollar has followed downside trend line breaks in the silver:gold ratio by several weeks over the past year, with the ratio again reversing sharply lower last week. Consequently, should the dollar follow the ratio lower over the near-term, we would expect gold to once again challenge its upside range this year.
