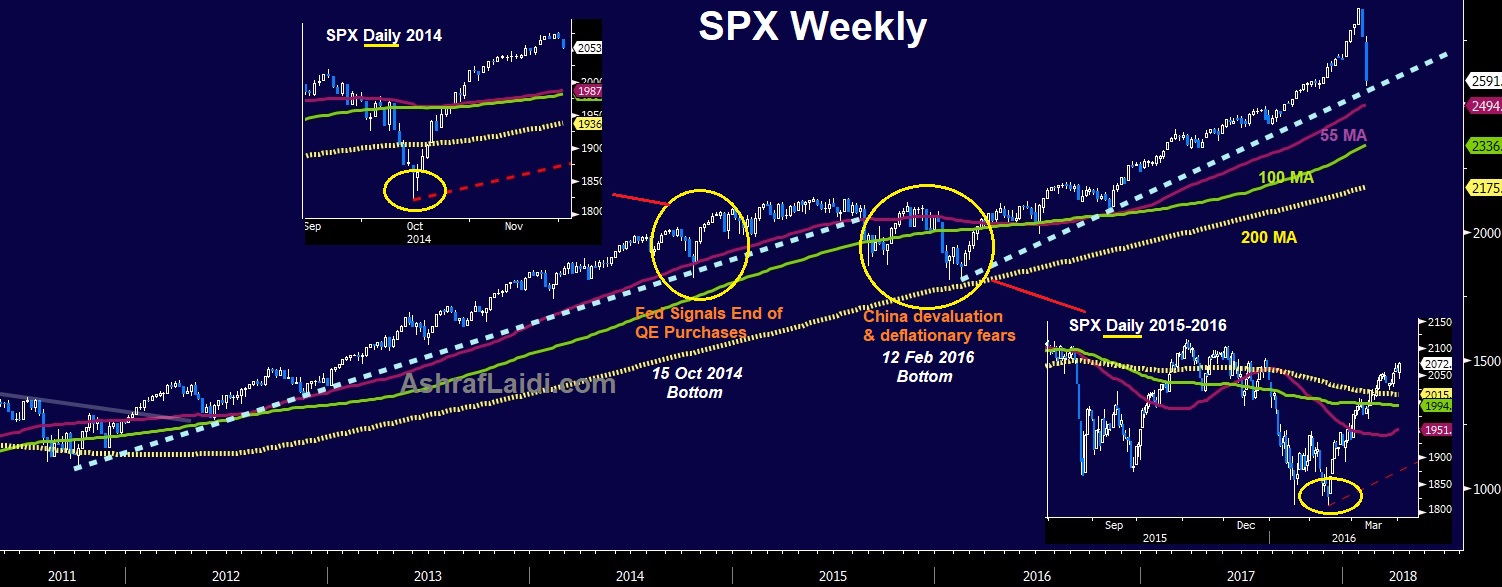
As the S&P 500 and Dow Jones Industrial Average post their fourth 10% decline in the past 4 years, we ask whether a violent spike is afoot, or if further erosion is underway. You're probably hearing discussions and analysis of what constitutes a correction (decline of 10%-19% from peak) and what is a bear market (-20% from peak).
- The current 10% decline stands out from the prior 10% selloffs (Sep-Oct 2014, Jul-Aug 2015 and Nov 2015-Feb 2016) in intensity, as it occurred in a matter of only 2 weeks. This was very much aided by the highest percentage magnitude in the Volatility Index (436% from its January low versus 386% in August 2015).
- The speed of the current selloff reflects 2 realities: i) the accumulation and subsequent implosion of retail longs in the XIV and SVXY (exchange traded instruments that allow investors to make leveraged bets on declining volatility); and ii) considerable implications for US indices due to the impact of rising bond yields on corporate credit and stock valuations. This was not the case in the China-driven seloffs, which were more worrying for emerging-markets paper than US instruments.
- Today’s selloff is occurring during the most synchronized policy tightening among the world’s major central banks, raising more credible fears about eroding “easy money” than any time during the last four years.
- The point of 10% decline in the S&P 500 (2,577) marks the trendline support from the Feb 12, 2016 bottom, which ended the last 105 decline. This raises the probabilities that a temporary bottom will occur around this point, despite possibly seeing prints of as low as 2,550 for those who trade futures, CFDs or spread-betting instruments.
3rd party Ad. Not an offer or recommendation by Investing.com. See disclosure here or
remove ads
.
- Technically, traders must also consider the 200-day moving average (currently at 2,539), a technical level that was last breached in June 2016 for one day before regaining it one day later.
- One thing that seems to be increasingly certain, is that the 100-day moving average (2,639) currently situated at the midpoint between the 55-DMA (2708) and the 200 DMA (2,539) will turn into a resistance level ahead of next week.
- Instead of gearing up for a sharp recovery toward the the 2,700s, traders ought to worry about further fluctuations between 2,530 and 2,680 for as long as the 10-year bond yield remains above 2.77%-2.80%.
Happy 2-year bottom anniversary.
