
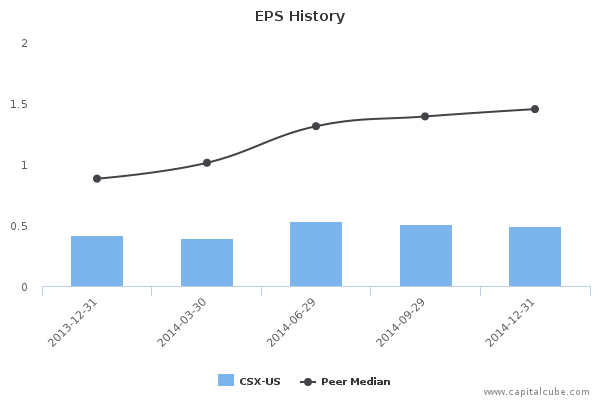
CSX Corporation (NYSE:CSX) reported preliminary financial results for the quarter ended December 31, 2014. The company generated record fourth-quarter earnings per share of $0.49, up 17 percent from $0.42 per share in 2013. Looking to 2015, the company continues to expect to generate double-digit growth in earnings per share and margin expansion in 2015.
This earnings release follows the earnings announcements from the following peers of CSX Corporation – Union Pacific Corporation (NYSE:UNP), Norfolk Southern Corporation (NYSE:NSC), Kansas City Southern (NYSE:KSU), Canadian National Railway Company (NYSE:CNI) and Canadian Pacific Railway (Canadian Pacific Railway Limited (NYSE:CP)).
See related articles: Union Pacific Corporation (UNP): Strong Earnings but Cautious Outlook, Norfolk Southern Corporation (NSC): Weak Quarter Owing to Revenue Fall, Canadian Pacific Railway (CP-CA): In-line Earnings Performance; No Change in Dividend, Canadian National Railway (CNR): Earnings Beat and a Dividend Positive Surprise, Kansas City Southern (KSU): Earnings beat despite revenue shortfalls.
Highlights
- Summary numbers: Revenues of USD 3192 million, Net Earnings of USD 491 million, and Earnings per Share (EPS) of USD 0.49.
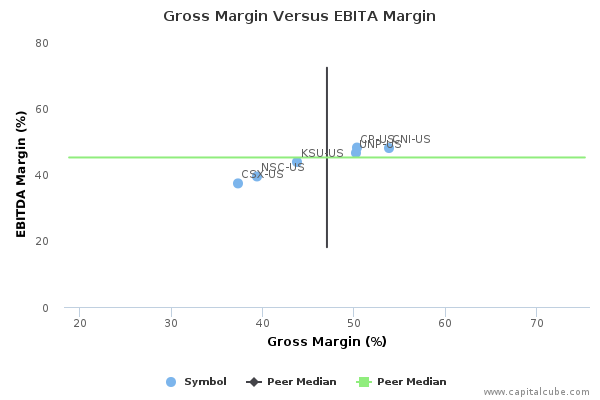
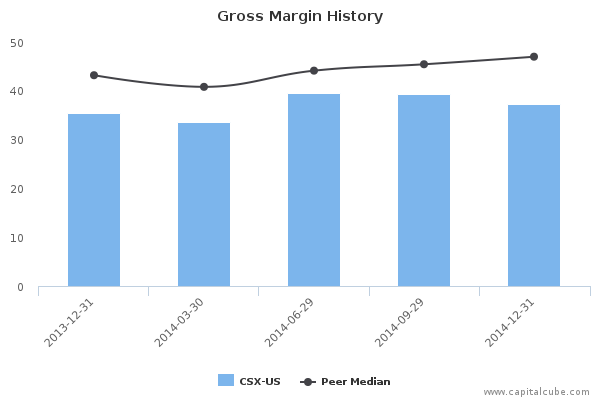
- Gross margins widened from 35.400% to 37.31% compared to the same quarter last year, operating (EBITDA) margins now 37.31% from 35.400%.
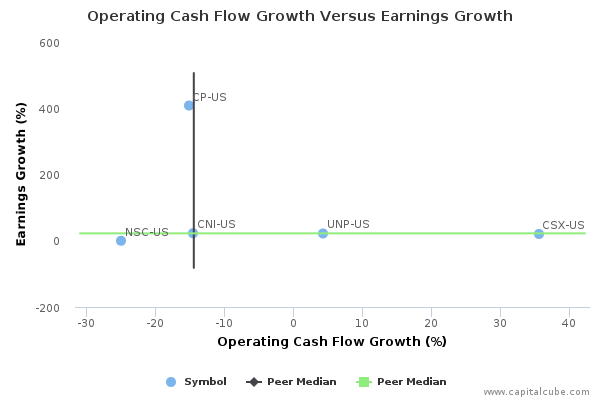
- Ability to declare a higher earnings number? Change in operating cash flow of 35.55% compared to same quarter last year better than change in earnings.
- Earnings growth from operating margin improvements as well as one-time items.
The table below shows the preliminary results and recent trends for key metrics such as revenues and net income growth:

Market Share Versus Profits
Companies sometimes focus on market share at the expense of profits or earnings growth.
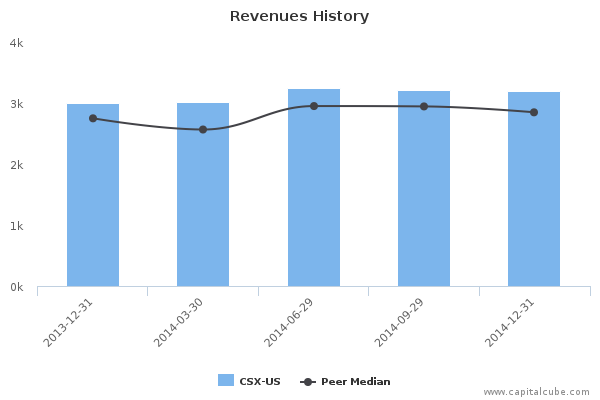
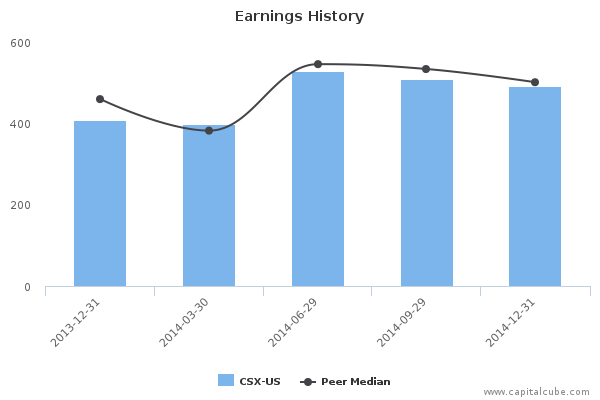
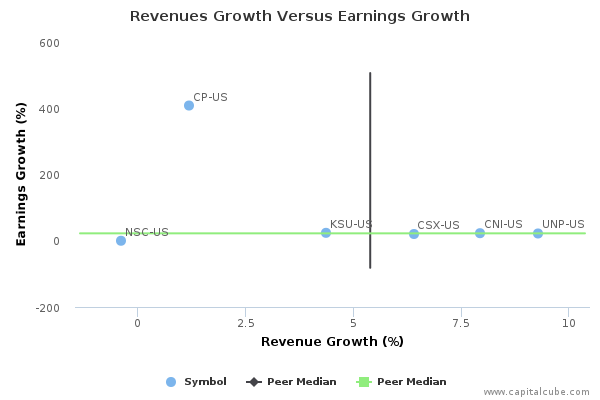
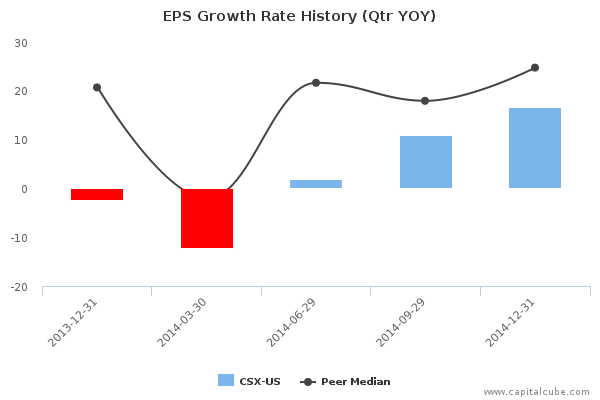
Compared to the same quarter last year, CSX's change in revenue trailed its change in earnings, which was 20.34%. The company's performance this period suggests a focus on boosting bottom-line earnings. While the revenue performance could be better, it is important to note that this quarterly change in revenue was among the highest in the peer group thus far. Also, for comparison purposes, revenue changed by -0.90% and earnings by -3.54% compared to the immediate last quarter.
Earnings Growth Analysis
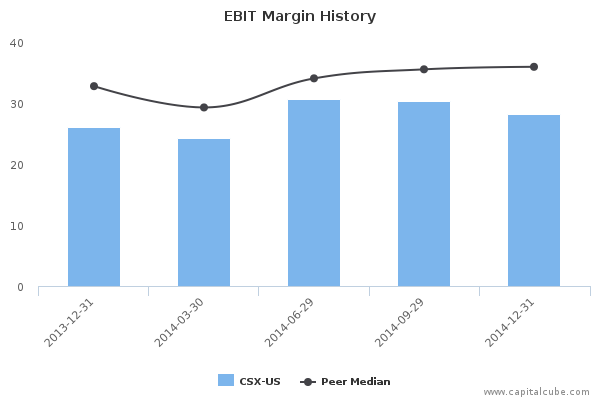
The company's earnings growth was influenced by year-on-year improvement in gross margins from 35.400% to 37.31% as well as better cost controls. As a result, operating margins (EBITDA margins) rose from 35.400% to 37.31% compared to the same period last year. For comparison, gross margins were 39.34% and EBITDA margins were 39.34% in the quarter ending September 30, 2014.
Gross Margin Trend
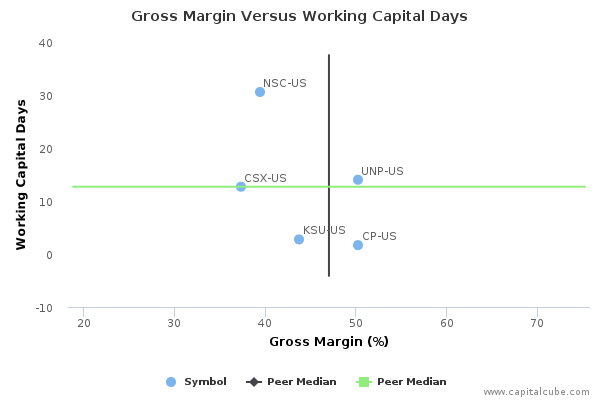
Companies sometimes sacrifice improvements in revenues and margins in order to extend friendlier terms to customers and vendors. Capital Cube probes for such activity by comparing the changes in gross margins with any changes in working capital. If the gross margins improved without a worsening of working capital, it is possible that the company's performance is a result of truly delivering in the marketplace and not simply an accounting prop-up using the balance sheet.
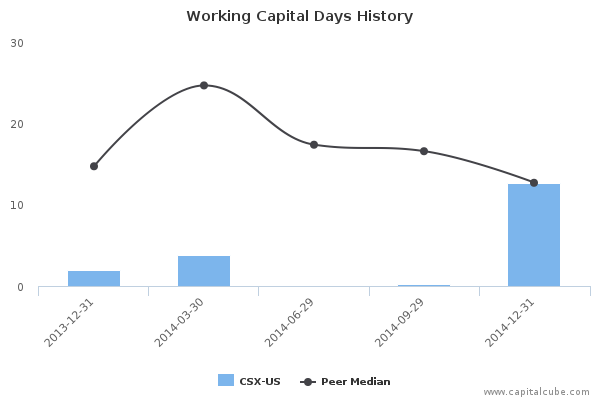
CSX's improvement in gross margins have been accompanied by a deterioration in the management of working capital. This leads Capital Cube to conclude that the improvements in gross margins are likely accounting trade-offs with the balance sheet and not strictly from operating decisions. Its working capital days have risen to 12.69 days from last year's levels of 1.93 days.
Cash Versus Earnings – Sustainable Performance?
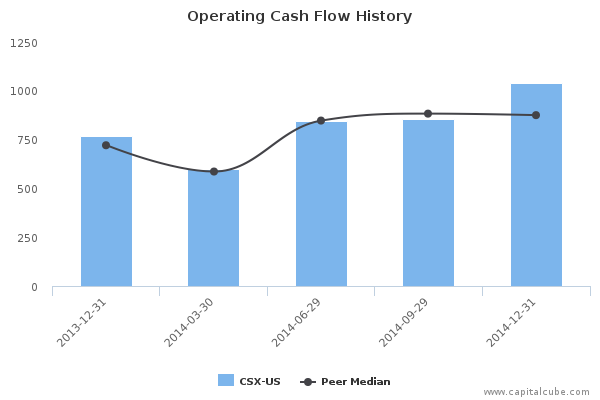

CSX's year-on-year change in operating cash flow of 35.55% is better than its change in earnings. This suggests that the company might have been able to declare a higher earnings number. The change in operating cash flow is better than the average of the results announced to date by its peer group.
Margins
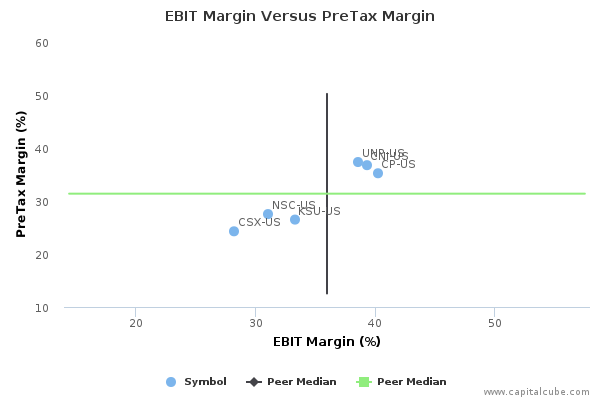
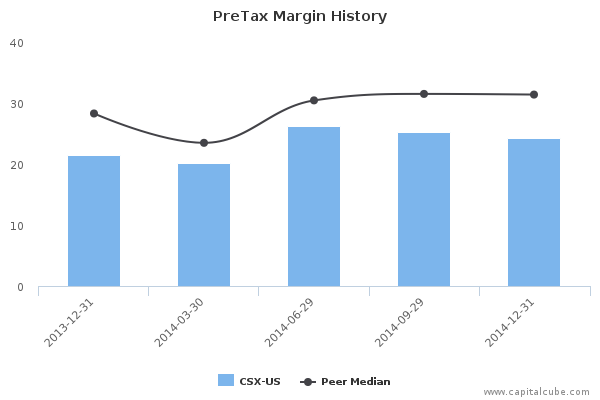
The company's earnings growth has also been influenced by the following factors: (1) Improvements in operating (EBIT) margins from 26.03% to 28.23% and (2) one-time items. The company's pretax margins are now 24.28% compared to 21.40% for the same period last year.
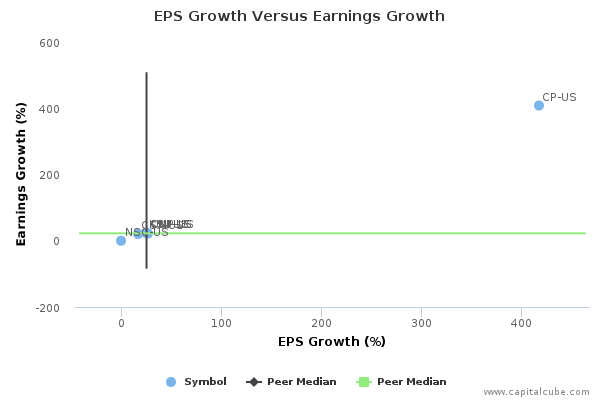
EPS Growth Versus Earnings Growth
Company Profile
CSX Corp. is a transportation supplier company. It provides rail-based transportation services including traditional rail service and the transport of intermodal containers and trailers. The company through its principal operating subsidiary, CSX Transportation, Inc., provides an important link to the transportation supply chain through its rail network. CSX was founded in 1827 and is headquartered in Jacksonville, FL.