
Union Pacific Corporation (UNP) reported preliminary financial results for the quarter ended December 31, 2014 – results that translated into a record earnings-per-share beat that was $0.10 above analysts' expectations. This was Union Pacific's largest earnings beat in 2014. The company's CEO attributed this record performance to “…strong volumes, solid core pricing and productivity gains.” However the company was cautious in its outlook for 2015 with looming labor issues on the West Coast ports likely to be a factor affecting the volume of goods carried by railroads.
This earnings release follows the earnings announcements from the following peers of Union Pacific Corporation – Kansas City Southern (NYSE:KSU), Norfolk Southern Corporation (NYSE:NSC), Canadian National Railway Company (NYSE:CNI), CSX Corporation (NYSE:CSX) and Canadian Pacific Railway Canadian Pacific Railway Limited (TO:CP).
See related articles: Norfolk Southern Corporation (NSC): Weak Quarter Owing to Revenue Fall, CSX Corporation: Strong Earnings and Strong Outlook, Canadian Pacific Railway (CP-CA): In-line Earnings Performance; No Change in Dividend, Canadian National Railway (CNR): Earnings Beat and a Dividend Positive Surprise, Kansas City Southern (KSU): Earnings beat despite revenue shortfalls.
Highlights
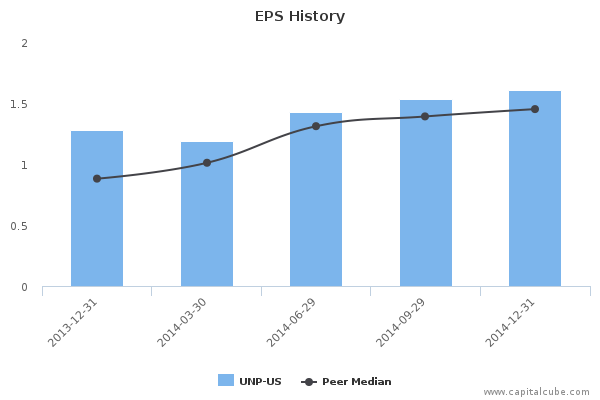
- Summary numbers: Revenues of USD 6153 million, Net Earnings of USD 1431 million, and Earnings per Share (EPS) of USD 1.61.
- Gross margins widened from 46.52% to 50.22% compared to the same quarter last year, operating (EBITDA) margins now 46.51% from 43.18%.
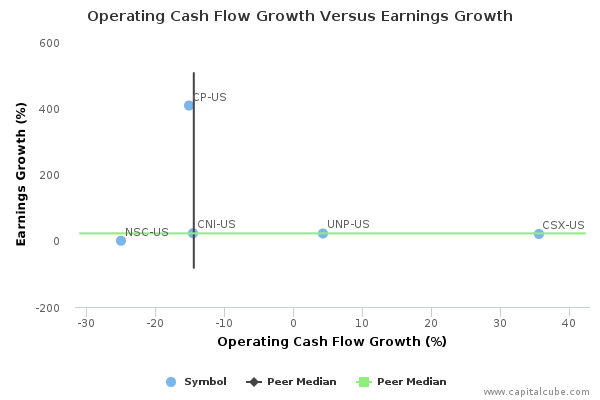
- Change in operating cash flow of 4.38% compared to same quarter last year trailed change in earnings, earnings potentially benefiting from some unlocking of accruals.
- Earnings growth from operating margin improvements as well as one-time items.
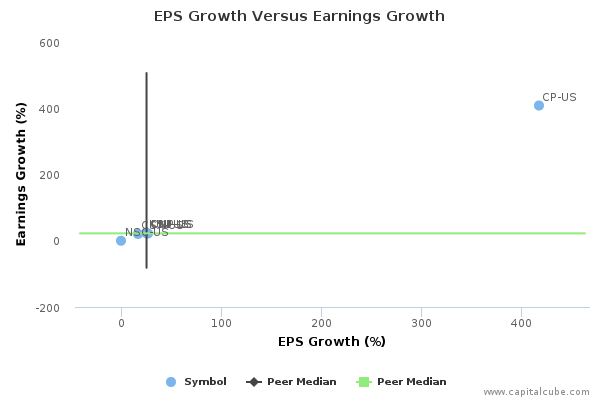
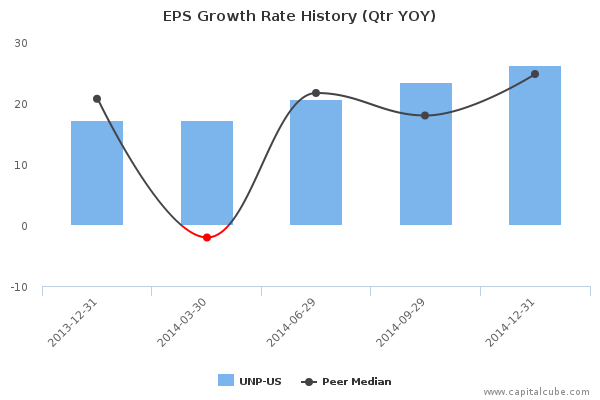
- Earnings per Share (EPS) growth exceeded earnings growth
The table below shows the preliminary results and recent trends for key metrics such as revenues and net income growth:

Market Share Versus Profits
Companies sometimes focus on market share at the expense of profits or earnings growth.

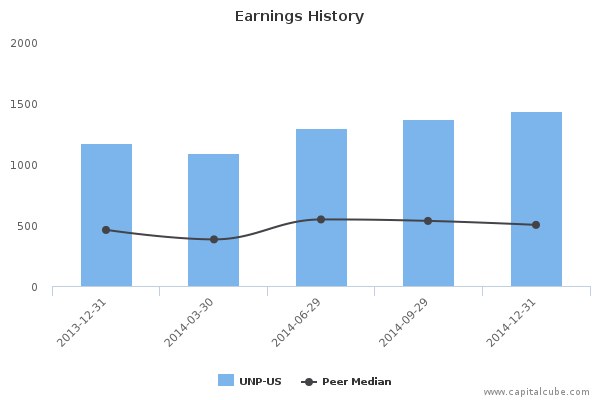
Compared to the same quarter last year, UNP's change in revenue trailed its change in earnings, which was 21.89%. The company's performance this period suggests a focus on boosting bottom-line earnings. While the revenue performance could be better, it is important to note that this quarterly change in revenue was among the highest in the peer group thus far. Also, for comparison purposes, revenue changed by -0.47% and earnings by 4.45% compared to the immediate last quarter.

Earnings Growth Analysis
The company's earnings growth was influenced by year-on-year improvement in gross margins from 46.52% to 50.22% as well as better cost controls. As a result, operating margins (EBITDA margins) rose from 43.18% to 46.51% compared to the same period last year. For comparison, gross margins were 49.39% and EBITDA margins were 45.47% in the quarter ending September 30, 2014.

Gross Margin Trend
Companies sometimes sacrifice improvements in revenues and margins in order to extend friendlier terms to customers and vendors. Capital Cube probes for such activity by comparing the changes in gross margins with any changes in working capital. If the gross margins improved without a worsening of working capital, it is possible that the company's performance is a result of truly delivering in the marketplace and not simply an accounting prop-up using the balance sheet.

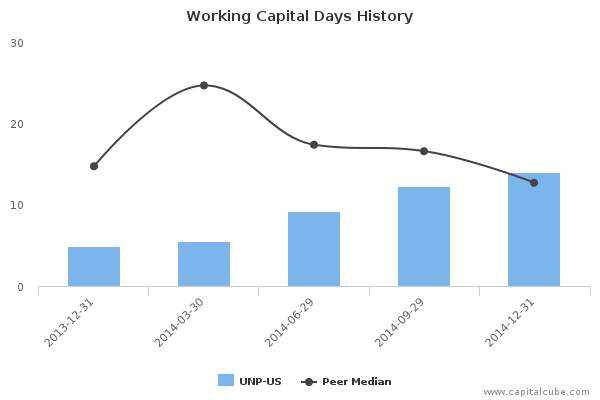
UNP's improvement in gross margins have been accompanied by a deterioration in the management of working capital. This leads Capital Cube to conclude that the improvements in gross margins are likely accounting trade-offs with the balance sheet and not strictly from operating decisions. Its working capital days have risen to 14.01 days from last year's levels of 4.91 days.

Cash Versus Earnings – Sustainable Performance?
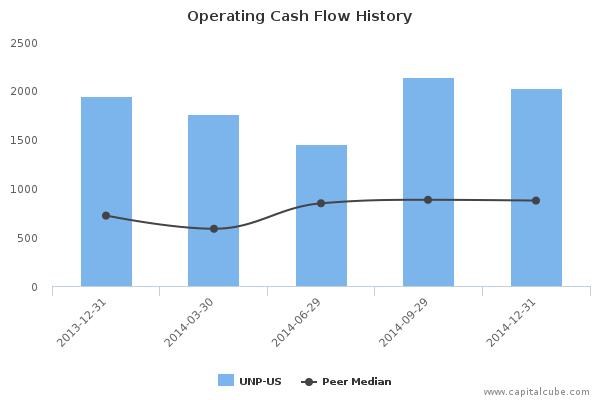
UNP's year-on-year change in operating cash flow of 4.38% trailed its change in earnings. This leads Capital Cube to question whether the earnings number might have been achieved from some unlocking of accruals. In addition, the increase in operating cash flow was less than the average announced thus far by its peer group.
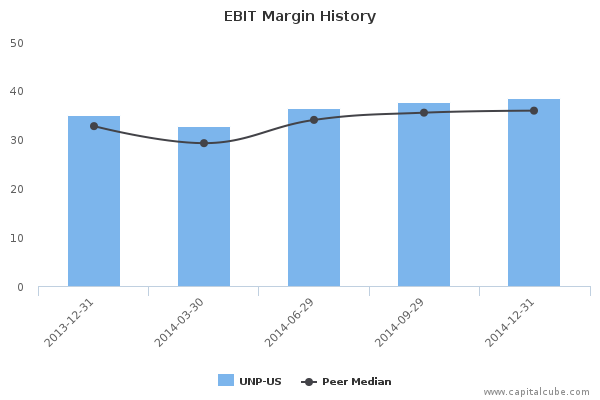
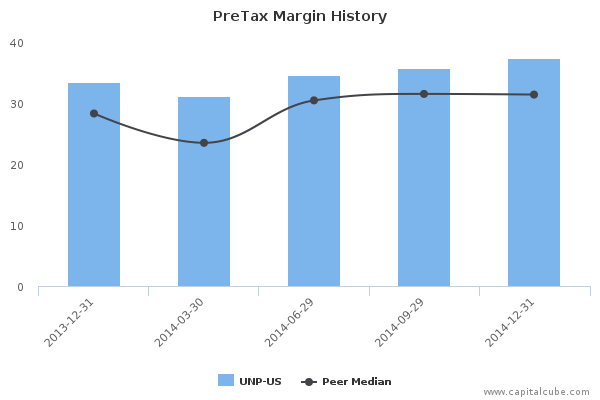
Margins
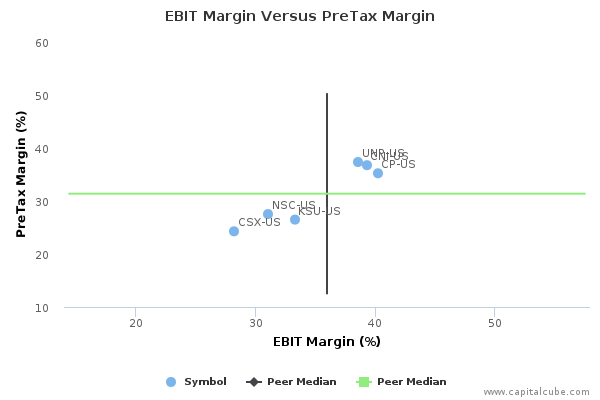
The company's earnings growth has also been influenced by the following factors: (1) Improvements in operating (EBIT) margins from 35.04% to 38.57% and (2) one-time items. The company's pretax margins are now 37.35% compared to 33.45% for the same period last year.

EPS Growth Versus Earnings Growth
UNP's change in Earnings per Share (EPS) of 26.27% compared to the same quarter last year is better than its change in earnings of 21.89%. At the same time, this change in earnings is less than the peer average among the results announced by its peer group, suggesting that the company is losing ground in generating profits from its competitors.
Company Profile
Union Pacific Corp. provides railroad and freight transportation services. Its principal operating company, Union Pacific Railroad Co., operates as a railroad franchise, covering 23 states across the western two-thirds of the United States by rail, providing a critical link in the global supply chain. The Railroad's diversified business mix includes Agricultural Products, Automotive, Chemicals, Coal, Industrial Products and Intermodal. The Agricultural Products business engages in the transportation of grains, commodities produced from these grains, and food and beverage products. It also serves significant domestic markets, including grain processors, animal feeders and ethanol producers in the Midwest, West, South and Rocky Mountain states.
The Automotive business engages in automotive carrier business in west of the Mississippi River and operates vehicle distribution centers. It serves vehicle assembly plants and connects to West Coast ports and the Gulf of Mexico to accommodate both import and export shipments. In addition to transporting finished vehicles, it provides expedited handling of automotive parts in both boxcars and intermodal containers destined for Mexico, the U.S. and Canada. The Chemicals business engages in transportation of chemicals. Its franchise serves the chemical producing areas along the Gulf Coast and also accesses chemical producers in the Rocky Mountains and on the West Coast. The company's chemical shipments include four broad categories: petrochemicals, fertilizer, soda ash, and other, which include sodium products, phosphorus rock and sulfur.
The Coal business includes the shipments of coal and petroleum coke to independent and regulated power companies and industrial facilities throughout the U.S. Through interchange gateways and ports, its reach extends to eastern U.S. utilities, Mexico, Europe and Asia. The Industrial Products business facilitates the movement of numerous commodities throughout North America. The Industrial Products group consists of several categories, including construction products, minerals, consumer goods, metals, lumber, paper, and other miscellaneous products. The Intermodal business includes two segments: International and Domestic. The International segment consists of import and export container traffic that mainly passes through West Coast ports. The Domestic segment includes container and trailer traffic picked up and delivered within North America for intermodal marketing companies (primarily shipper agents and logistics companies), as well as truckload carriers. Union Pacific was founded in 1969 and is headquartered in Omaha, NE.