
Canadian Pacific Railway (NYSE:CP) reported preliminary financial results for the quarter ended December 31, 2014. Earnings were largely in-line with the consensus analysts estimate but the company did not increase its dividend. The company's current earnings look much better compared to the same quarter last year because of the presence of large unusual expenses last year.
This earnings release follows the earnings announcements from the following peers of Canadian Pacific Railway – Canadian National Railway Company (TO:CNR), Norfolk Southern Corporation (NYSE:NSC), Union Pacific Corporation (NYSE:UNP), Kansas City Southern (NYSE:KSU) and CSX Corporation (NYSE:CSX).
See related articles: Union Pacific Corporation (UNP): Strong Earnings but Cautious Outlook , Norfolk Southern Corporation (NSC): Weak Quarter Owing to Revenue Fall, CSX Corporation: Strong Earnings and Strong Outlook, Canadian National Railway (CNR): Earnings Beat and a Dividend Positive Surprise, Kansas City Southern (KSU): Earnings beat despite revenue shortfalls.
Highlights
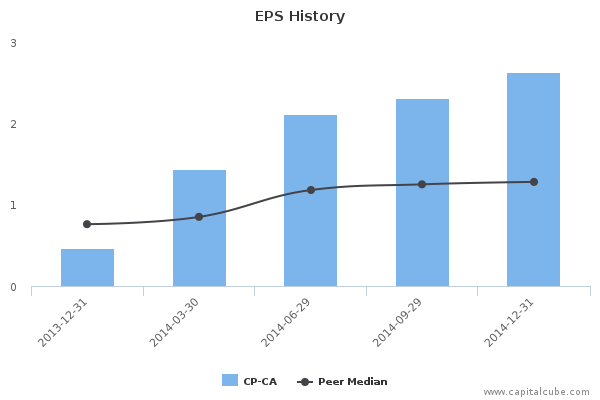
- Summary numbers: Revenues of CAD 1760 million, Net Earnings of CAD 451 million, and Earnings per Share (EPS) of CAD 2.63.
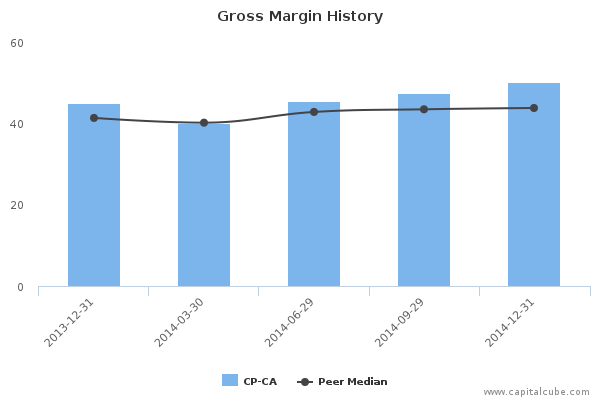
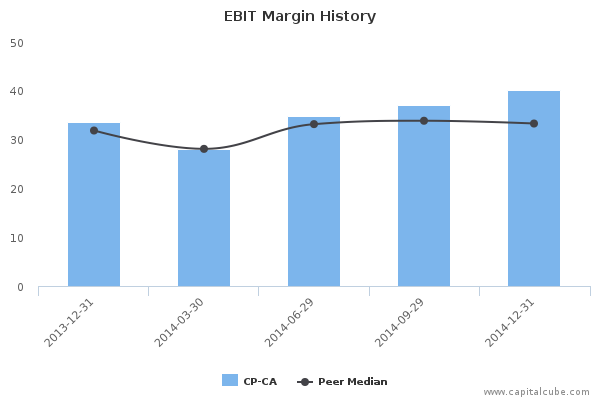
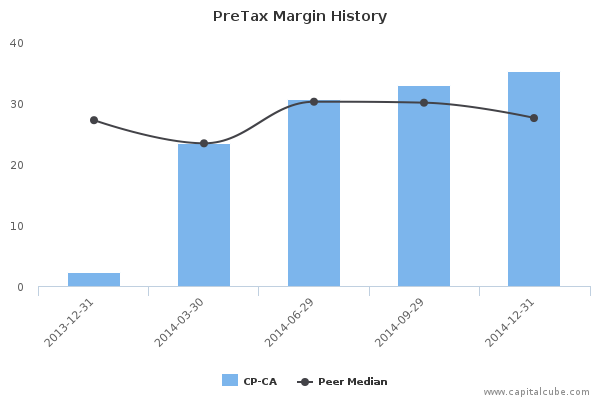
- Gross margins widened from 45.05% to 50.28% compared to the same quarter last year, operating (EBITDA) margins now 48.13% from 42.63%.
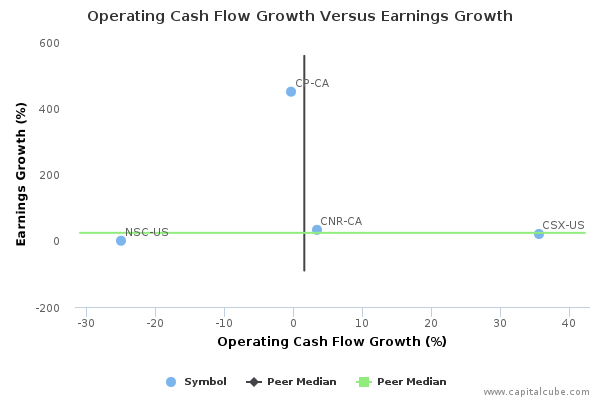
- Change in operating cash flow of -0.30% compared to same quarter last year trailed change in earnings, earnings potentially benefiting from some unlocking of accruals.
- Earnings growth from operating margin improvements as well as one-time items.
- Earnings per Share (EPS) growth exceeded earnings growth.
The table below shows the preliminary results and recent trends for key metrics such as revenues and net income growth:

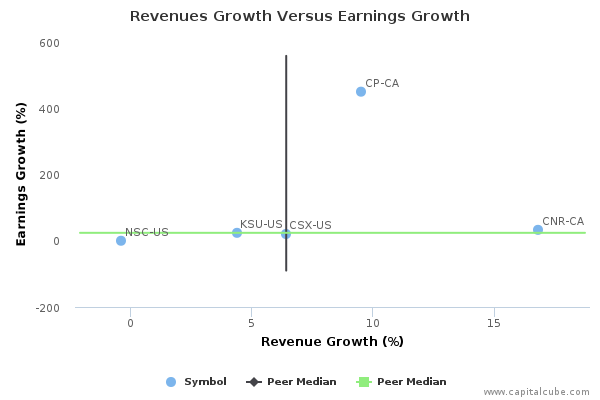
Market Share Versus Profits
Companies sometimes focus on market share at the expense of profits or earnings growth.
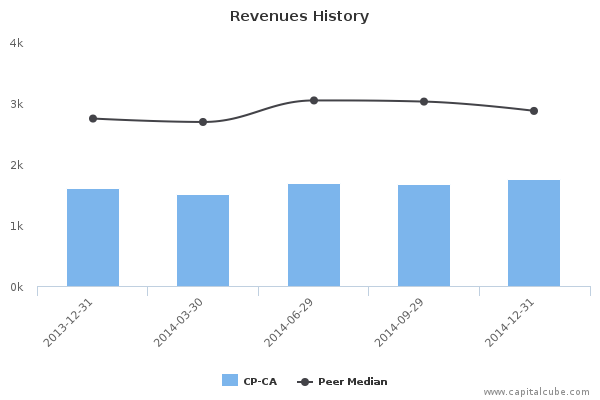
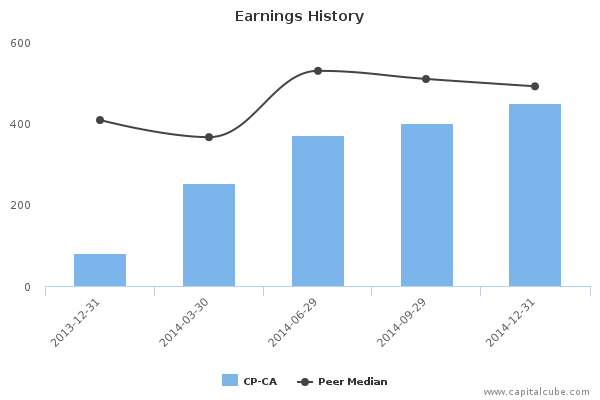
Compared to the same quarter last year, CP's change in revenue trailed its change in earnings, which was 450%. The company's performance this period suggests a focus on boosting bottom-line earnings. While the revenue performance could be better, it is important to note that this quarterly change in revenue was among the highest in the peer group thus far. Also, for comparison purposes, revenue changed by 5.39% and earnings by 12.75% compared to the immediate last quarter.
Earnings Growth Analysis
The company's earnings growth was influenced by year-on-year improvement in gross margins from 45.05% to 50.28% as well as better cost controls. As a result, operating margins (EBITDA margins) rose from 42.63% to 48.13% compared to the same period last year. For comparison, gross margins were 47.43% and EBITDA margins were 45.27% in the quarter ending September 30, 2014.
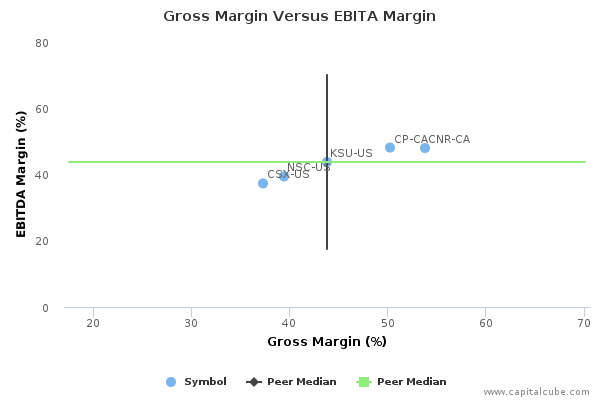
Gross Margin Trend
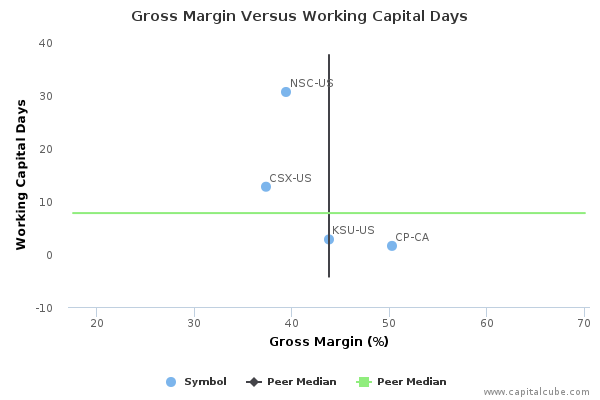
Companies sometimes sacrifice improvements in revenues and margins in order to extend friendlier terms to customers and vendors. Capital Cube probes for such activity by comparing the changes in gross margins with any changes in working capital. If the gross margins improved without a worsening of working capital, it is possible that the company's performance is a result of truly delivering in the marketplace and not simply an accounting prop-up using the balance sheet.
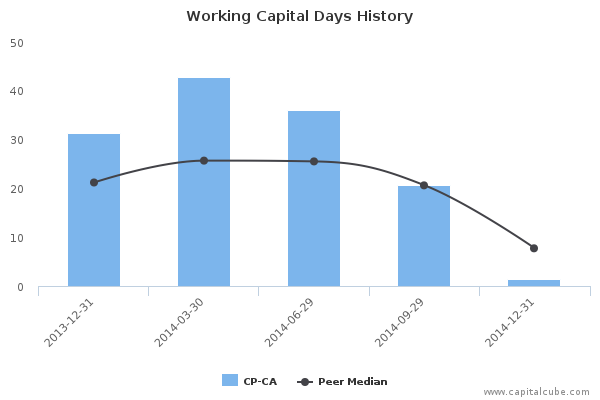
CP's improvement in gross margin has been accompanied by an improvement in its balance sheet as well. This suggests that gross margin improvements are likely from operating decisions and not accounting gimmicks. Its working capital days have declined to 1.53 days from 31.40 days for the same period last year.
Cash Versus Earnings – Sustainable Performance?
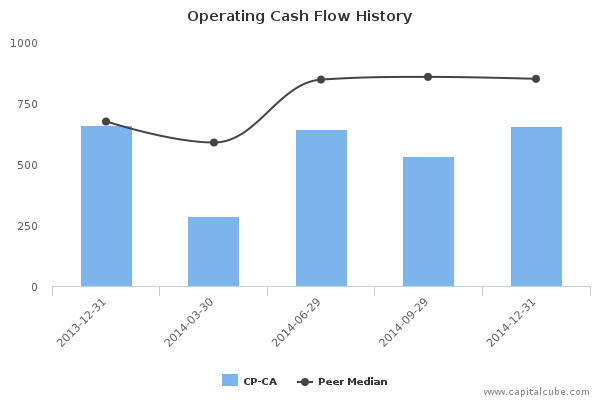
CP's year-on-year change in operating cash flow of -0.30% trailed its change in earnings. This leads Capital Cube to question whether the earnings number might have been achieved from some unlocking of accruals. On a positive note, the increase in operating cash flow was better than the average announced thus far by its peer group.
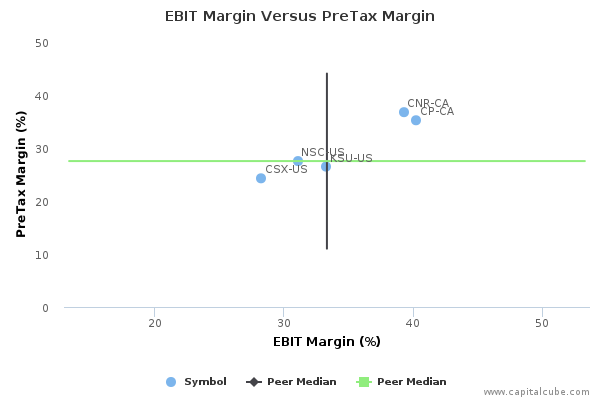
Margins
The company's earnings growth has also been influenced by the following factors: (1) Improvements in operating (EBIT) margins from 33.67% to 40.23% and (2) one-time items. The company's pretax margins are now 35.23% compared to 2.36% for the same period last year.

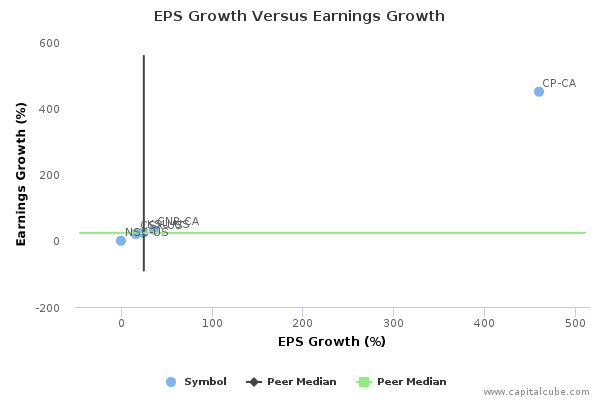
EPS Growth Versus Earnings Growth
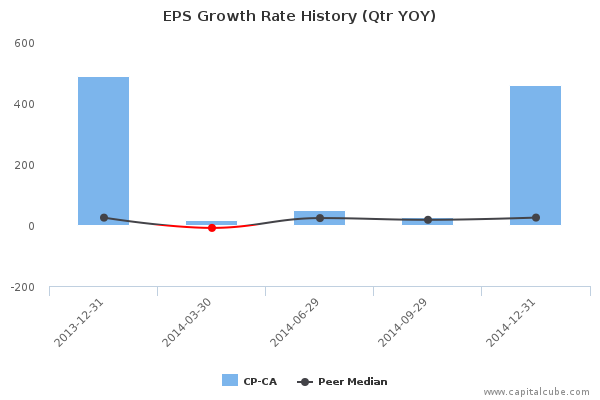
CP's change in Earnings per Share (EPS) of 459.57% compared to the same quarter last year is better than its change in earnings of 450%. However, this change in earnings is better than the peer average among the results announced to date, suggesting that the company is gaining ground in generating profits from its competitors.
Company Profile
Canadian Pacific Railway Ltd. through its subsidiaries operates a transcontinental railway in Canada and the U.S. and provides logistics and supply chain expertise. The company provides rail and intermodal transportation services to business centre of Canada from Montreal, Quebec, to Vancouver, British Columbia, and the U.S. Northeast and Midwest regions. It transports bulk commodities, merchandise freight and intermodal traffic. Canadian Pacific Railway was founded in 1881 and is headquartered in Calgary, Canada.