Return correlations for the major asset classes have edged down in recent years, which implies that diversification opportunities have increased, if only marginally. The correlation readings are only modestly softer overall and for several asset class pairings it’s fair to say that nothing much has changed. But reviewing all the key slices of global markets by way of pairwise return correlations shows that the median for this risk metric has slipped, based on a set of proxy ETFs.
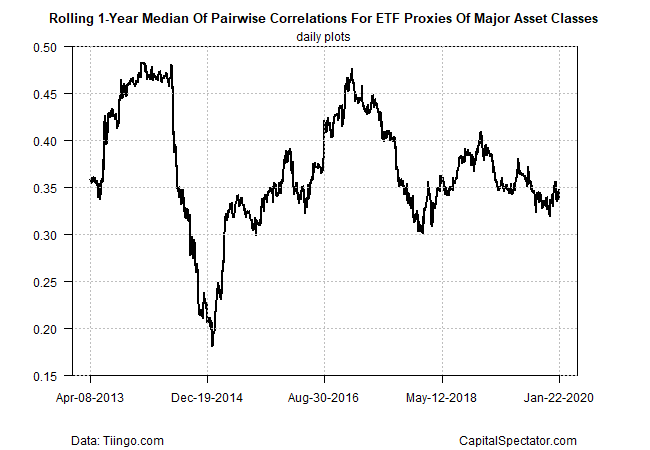
The median correlation for the major asset classes was 0.34 at yesterday’s close (Jan. 22), based on daily returns for the current one-year rolling period (252 trading days). That’s close to the previous low of 0.30 that was reached in the early weeks of 2018. Despite the latest downtick, the median correlation is still well above the low for the past decade: 0.19 in early 2015. (Note: correlation readings range from -1.0 (perfect negative correlation) to zero (no correlation) to +1.0 (perfect positive correlation.))
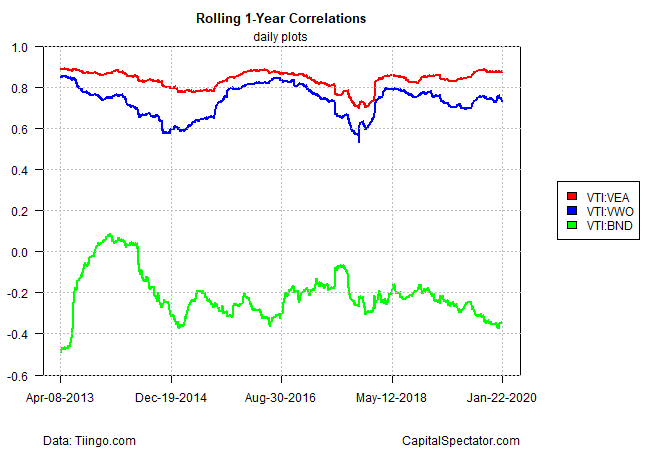
Let’s drill down into the data and focus on a select group of return pairings via the correlations between the US stock market and foreign equities in developed, emerging markets and also vs. US bonds. On this front, two distinct trends are clear. First, the correlations between US and foreign stocks have remained relatively high and mostly stable, based on Vanguard Total US Stock Market (NYSE:VTI) vs. Vanguard FTSE Developed Markets (NYSE:VEA) and VTI vs. Vanguard FTSE Emerging Markets (NYSE:VWO). For US equities vs. US bonds — based on Vanguard Total Bond Market (NYSE:BND) – the correlation has been drifting deeper into negative terrain over the past year and is currently at -0.35, close to the lowest print in recent years (green line in chart below).
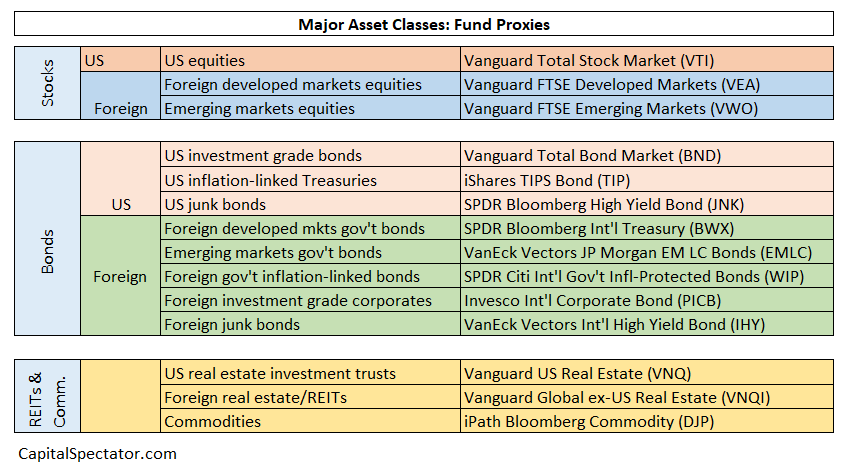
For a broader review of correlations, let’s look at the complete data set for all the major asset classes, based on the following fund proxies:
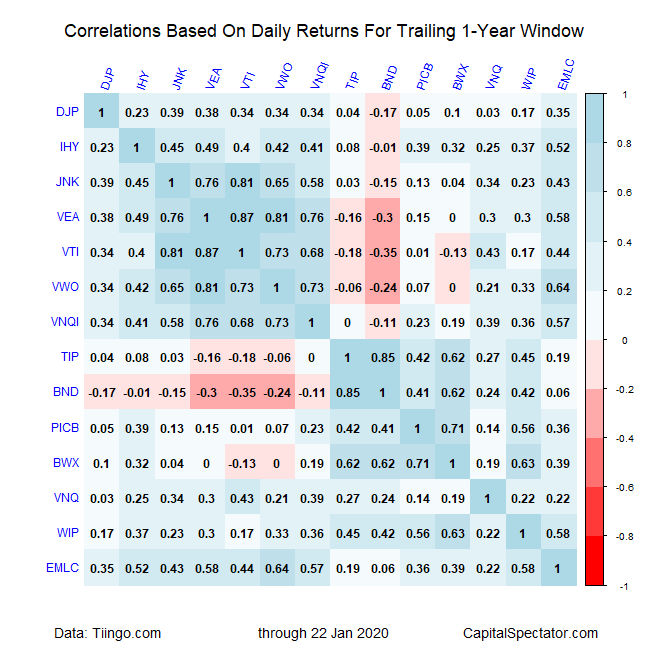
Using the ETFs above for analysis shows that most of the correlation pairings for daily returns over the past year are positive in varying degrees, although there are several pockets of mildly negative results. The deepest negative correlation is currently between US stocks (VTI) and US bonds (BND) at -0.35. Keep in mind that even positive correlations can provide significant diversification benefits for portfolio design, particularly for pairings below 0.80. Note, too, that the lowest correlations are posting a modestly deeper shade of red compared with the Oct. 2018 profile.
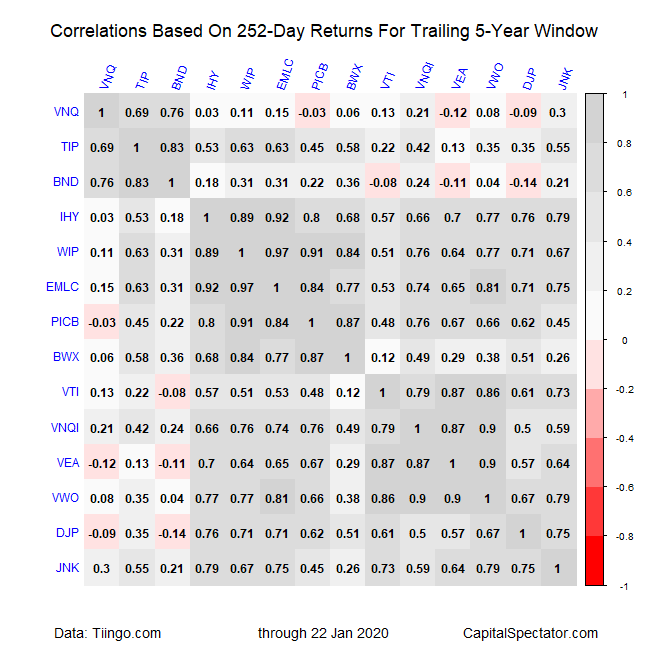
For another perspective, the next table below maps all the pairwise correlations for daily returns on the basis of the current five-year trailing window. Using this longer time frame shows that correlations can be lower in some cases vs. the one-year period review. That’s a reminder that the diversification possibilities for portfolio design may be more robust at longer-term horizons.
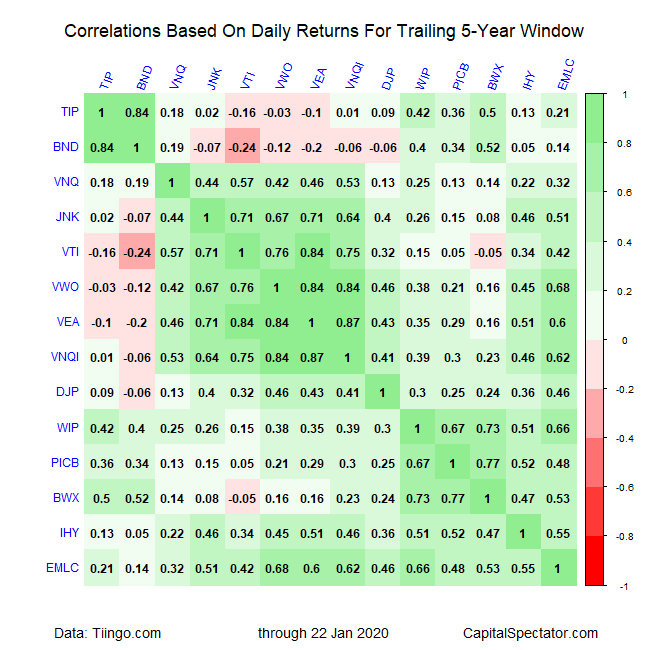
Finally, here’s another perspective based on rolling one-year returns (252 trading days) to calculate correlations for the trailing five-year period through yesterday. Analyzing correlations via this time period suggests that substantial diversification opportunities exist for building a multi-asset class portfolio that’s held through time.
