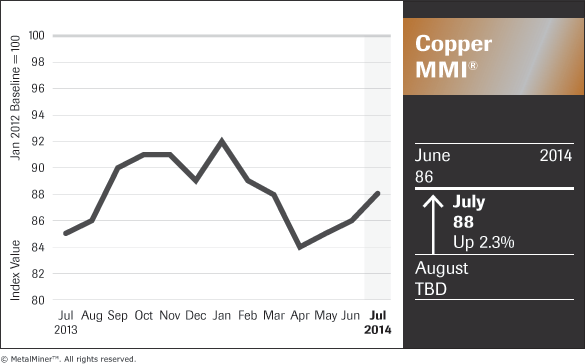
The monthly Copper MMI® registered a value of 88 in July, an increase of 2.3% from 86 in June.

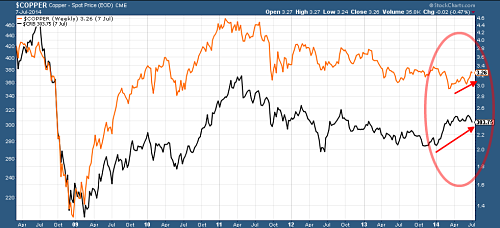
Copper surged 11% since March, this seems like a big rise but we need to remember that this increase followed a 15% decline in the first quarter. Interestingly, in March we talked about the divergence that was happening between copper and commodities and we pointed out that these two would have to converge. We also commented that the rise in commodities was a warning signal for industrial metals.

Today we can see how copper is trying to catch up with commodities. The short term boost both in copper and commodities might be explained by the recent recovery in China, thanks to support from some stimulus measures taken by its government. Yet, we should note that the Chinese economy still has yet to reach its pre-crisis level and who knows how long this stimulus-backed recovery will last?

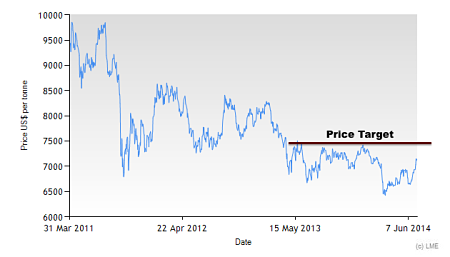
Meanwhile, despite its recent surge, copper remains at low levels. If China continues showing improvement and commodities keep pushing their way up, copper should follow. However, it is still a bit early to call that and, therefore, it is risky to take long-term positions at this point. Those improvements, if they happen, will be reflected in the price. The right time to go long on copper is if prices cross above $7,500/ton. At that point, copper buyers should be completely hedged. Aluminum is another metal showing similar behavior, and we believe that the same approach should be taken.
The Chinese copper cash price closed the month up 3.9% at $8,502 per metric ton. The price of Chinese copper wire rose 2.1% over the past month to $8,183 per metric ton, the second straight month of gains. At $3.88 per pound, the price of US copper producer grade 110 finished the month 1.3% higher. This was the second straight month of declines. For the second month in a row, the price of US copper producer grade 102 increased, rising 1.2% over the past month to $4.07 per pound. At $6,932 per metric ton, the copper 3-month price increased 0.4% on the LME.
The primary copper cash price ended the month on the LME at $6,954 per metric ton, down from $6,954. The Japanese copper cash price fell a slight 0.3% over the past month to $7,265 per metric ton.
The price of Korean copper strip held steady around $9.53 per kilogram last month. At a price of $7,140 per metric ton, Chinese bright copper scrap did not budge the entire month.
Disclaimer: The Copper MMI® collects and weights 12 global copper metal price points to provide a unique view into copper price trends over a 30-day period. For more information on the Copper MMI®, how it’s calculated or how your company can use the index, please drop us a note at: info (at) agmetalminer (dot) com.
