The knee-jerk reaction to the (temporary) end to the U.S. government shutdown saw the U.S. dollar weaken, which helped most metals to advance. Oil prices were hit by demand concerns when faced with a global economic slowdown, while the agricultural sector is being held captive by the weather and the outcome of the next phase of U.S.-China trade negotiations.
NOTE: There will be no Commodities Weekly publication next week due to the Lunar New Year holidays
Precious metals
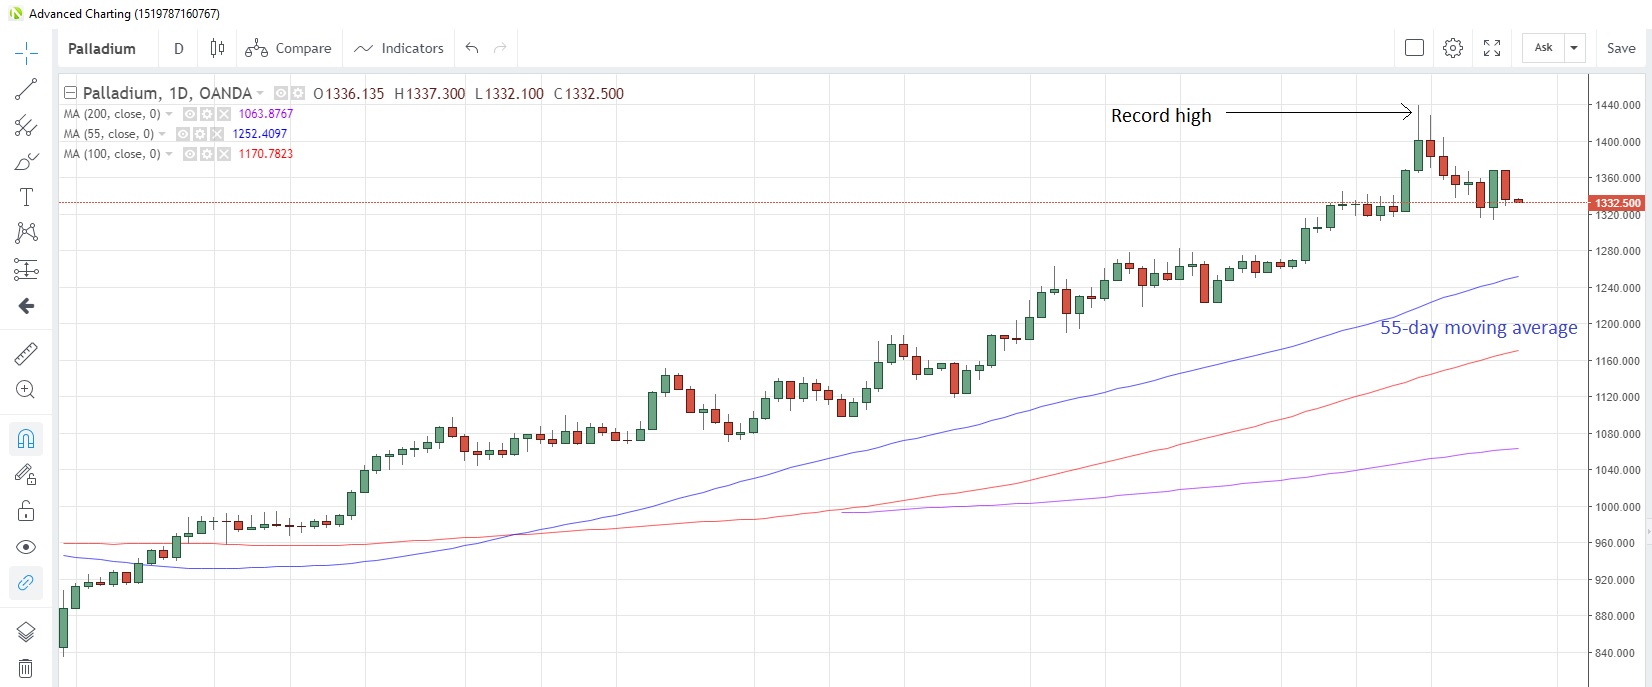
Palladium looks poised for its second weekly decline as the strong bullish run that started in the final quarter of last year comes to an end, at least in the near term. The precious metal has fallen as much as 7.7% from its record high of 1,439.55 reached on January 17. The 55-day moving average is at 1,252.4 and prices have been above this average since August 24. There is still a global shortage of the metal and demand is seen increasing, so any downward correction is seen as only temporary.
Palladium Daily Chart
 Source: OANDA fxTrade
Platinum snapped a three-day winning streak yesterday as the 100-day moving average at 819.89 proved to be too stubborn a resistance point to overcome. Prices are now sandwiched between the 100-day moving average and the 55-day one at 811.36. Platinum producer Anglo American (LON:AAL) announced it was trimming its 2019 output forecast to 2.0-2.1 million ounces from an earlier goal of 2.2 million ounces.
Gold finally broke through the 1,300 ceiling last Friday, pushed higher by a weaker U.S. dollar as an end to the U.S. government shutdown was announced and amid rumours the Fed was considering an earlier-than-expected end to its bond portfolio wind down. Friday’s rise meant the week’s gains were the most in four weeks. The metal has since consolidated above this threshold and is now at 1,303.
The weaker dollar also helped silver to climb to a three-week high after posting the biggest one-day gain in nearly three months on Friday. Capital Economics, a leading independent macroeconomic research company, has revised its silver forecast for end-2019 higher to 17.50 amid safe haven buying by investors as it sees falls in global equity markets and slower economic growth.
Base metals
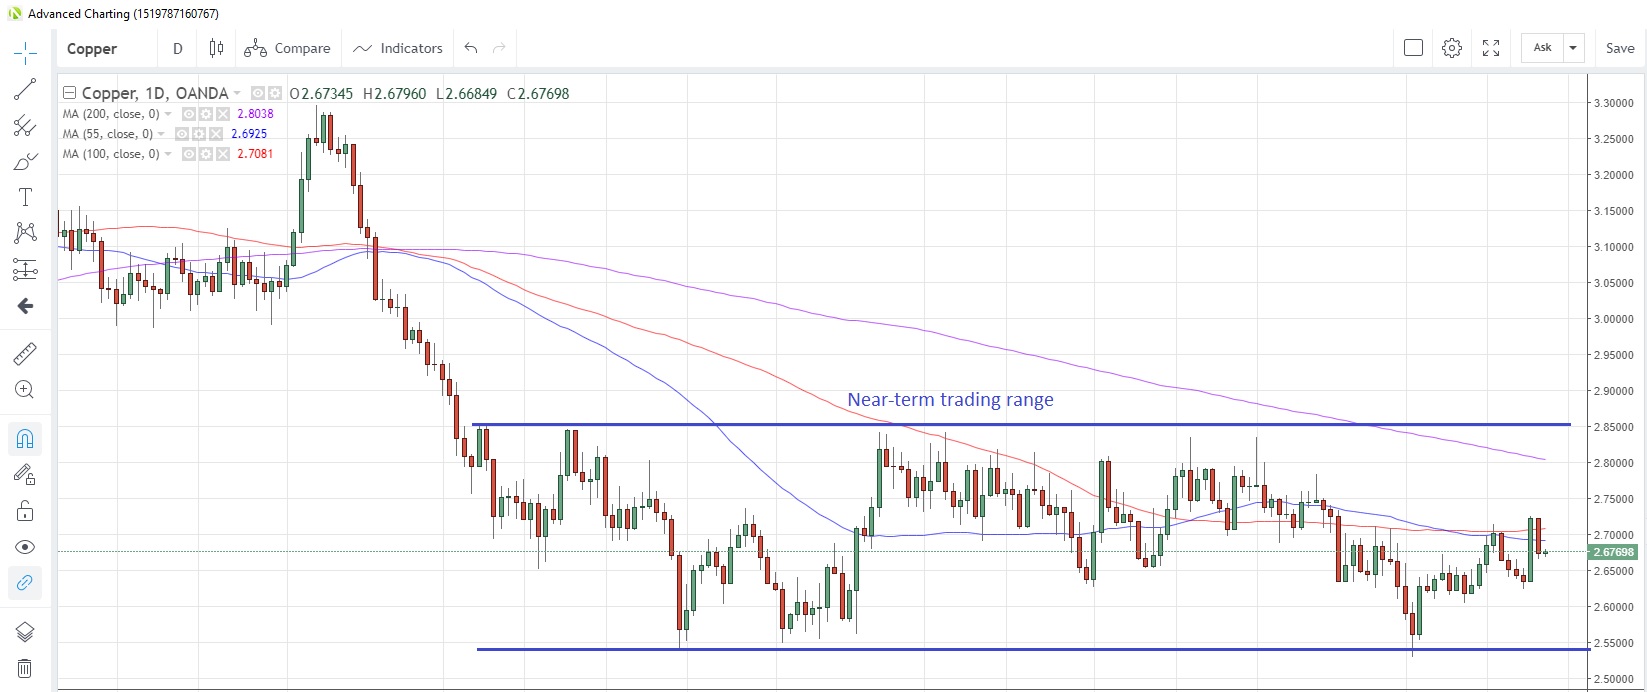
Copper has been struggling to break out of a 2.55-2.85 range for the past six months, and this has left investors in a quandary as to which position to hold. A recently weekly poll of traders conducted by Bloomberg showed more than half of the respondents were neutral on the metal, and were awaiting further developments in the US-China trade negotiations. This could give a clearer picture of the prospects for global growth and hence demand for the industrial metal.
Copper Daily Chart
Source: OANDA fxTrade
Iron ore prices surged yesterday, with futures on China’s Dalian exchange closing at the highest level in more than a year as a deadly dam collapse at a copper mine in Brazil spurred concerns about a disruption to global supplies.
Energy
Crude oil posted its biggest one-day decline in a month yesterday amid demand concerns from a global economic slowdown and an increase in supply. The number of U.S. drilling rigs in operation increased for the first time this year, according to weekly data released last Friday. Furthermore, EIA stockpiles data showed an inventory build of 7.97 million barrels in the week to January 18 versus an expected drawdown of 42,000 barrels.
In addition, speculation grew yesterday that the U.S. government was considering releasing oil from the U.S. Strategic Petroleum Reserve in order to coincide with possible sanctions imposed on Venezuela exports, according to industry benchmark and information provider Platts. Meanwhile, Saudi Energy Minister Khalid al-Falih said the Venezuelan crisis has had zero impact on the oil market so far, while Saudi oil production will likely be “well below” the voluntary cap for a full six months.
West Texas Intermediate is currently at $52.015 after testing 55-day moving average support at $51.153
Natural gas is hovering near four-month lows despite unusually cold weather. Freezing weather is gripping most of the U.S. Midwest as arctic air circulates. The freezing weather caused a drawdown of natural gas inventories of 163 billion cubic meters in the week to January 18, according to EIA, the biggest reduction since February last year. Despite this demand, gas prices remain sluggish, hitting the lowest since January 3 yesterday, which in turn was the lowest since October. Gas is now at 2.974.
Agriculturals
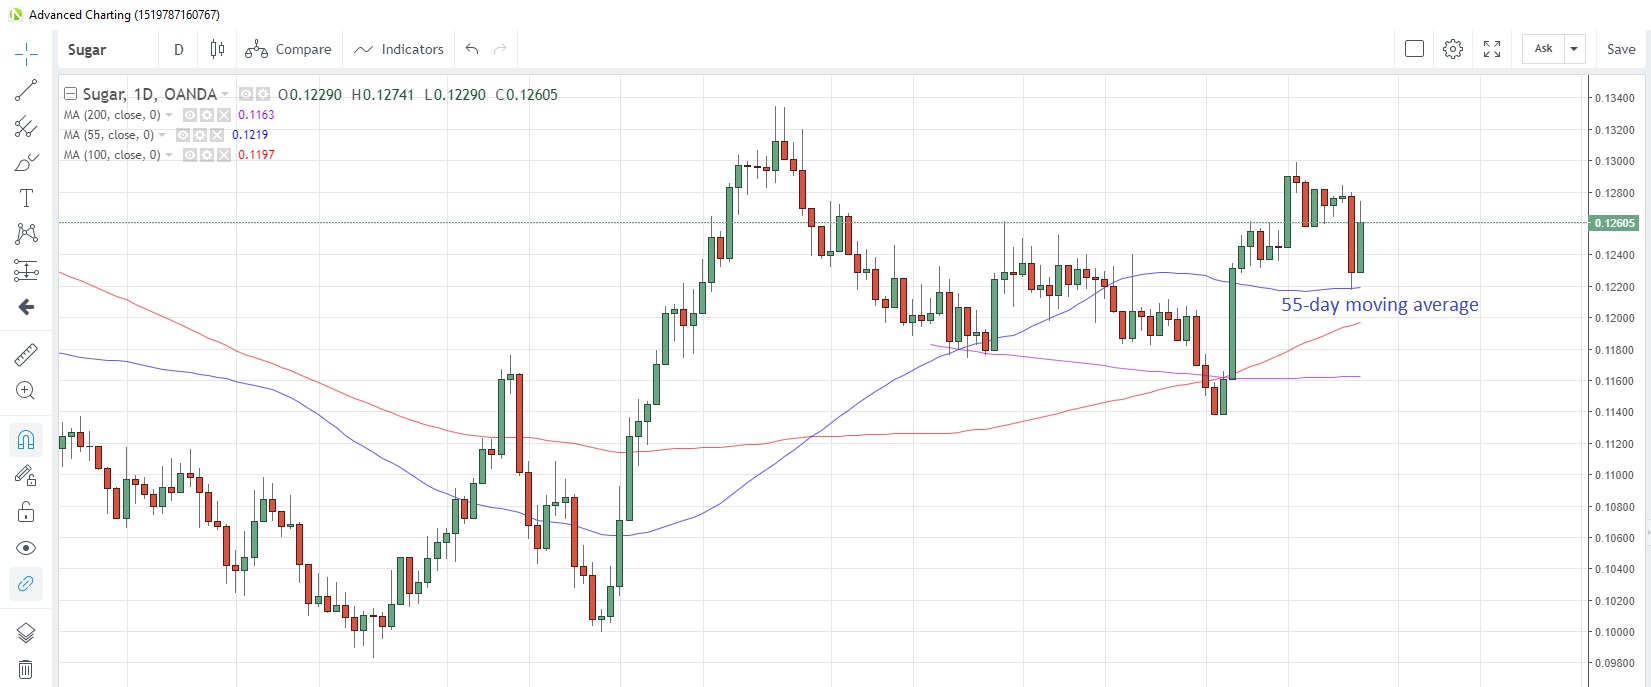
Sugar prices fell the most since September on Friday on the continuing theme of oversupply. Prices touched the 55-day moving average for the first time in three weeks and are now at 0.1261. One of India’s top exporters said the country is expected to continue with sugar exports in the 2019-20 season, adding to an existing global glut. In addition, Kenya announced that its 2018 production jumped 31% to 491,000 tons.
Sugar Daily Chart
Source: OANDA fxTrade
Wheat prices are virtually unchanged from a week ago with lower production out of Brazil countered by forecasts of increased output from Canada. An extended dry spell in Brazil and heavier-than-normal rainfall in Argentina are raising concerns about a supply deficit from the region, though this was compensated somewhat by reports that Canada expected to produce 33 million tons of wheat in the 2019-20 season, a 3.9% increase from a year ago. Wheat is now at 5.106 with the combination of 55-, 100- and 200-day moving averages slowing rising to meet current prices, creating a support window in the 5.0105-5.0454 area.
Corn output is also being affected by the weather, though there are hopes that pending rain in Brazil might revive corn and soybean crops. Corn prices have struggled to overcome resistance at the 3.75 level for the past two months. Corn is now at 3.726 after numerous failed attempts at 3.75 since December.
Soybeans are holding close to seven-week highs, consolidating above the 200-day moving average at 8.9666, which was conquered early last week. The next directional move will likely be determined by the outcome of the next US-China trade negotiations to be held tomorrow and Thursday in the U.S. Soybeans are currently trading at 9.093.


