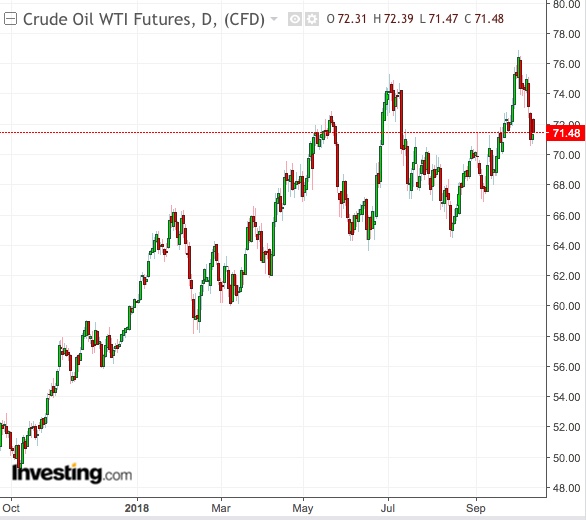
The elephant in the commodities room this week will be the two-month old rally in crude oil, and whether it’ll come back from last week’s beating.
Down more than 4 percent in five sessions—a decline of this magnitude last seen in the second quarter—New York’s West Texas Intermediate (WTI) crude and its UK peer Brent oil have raised question marks over their direction as commodity markets enter another week of global macro uncertainty.
While crude debuted higher for the week in Asia, helped by geopolitical tensions related to the disappearance of a prominent Saudi journalist, gains were limited by concerns over the longer-term outlook, traders said.
To be sure, oil has some critical supply concerns that should support prices higher, chiefly US sanctions against Iranian crude exports, which, at their peak of 2.71 million barrels per day in May, were equivalent to nearly 3 percent of daily global supply.
Aside from Iran—the third largest oil exporter in the Organization of the Petroleum Exporting Countries (OPEC)—supply is also at risk in other OPEC nations such as Iraq, Libya and Venezuela.
Risk Aversion Tempering Oil’s Bullish Outlook

But those concerns have also been partially offset by the belief of some market players that, over the past year, prices have risen more than adequately to compensate for any tightness in supply. Even with last week’s slide, WTI and Brent are still up about 40 percent each from a year ago. And US crude stockpiles have soared in the meantime, while agencies such as OPEC and the West’s energy watchdog IEA have warned of an oil glut rather than squeeze by next year, should economic worries overwhelm consumers.
Add to that the backdrop of a falling stock market, soaring US Treasury yields and Federal Reserve plans for higher interest rates through 2020, and the motivation for risk aversion couldn’t be greater.
Dominick Chirichella of the Energy Management Institute in New York said:
“The upward movement in prices that began in mid-August has been driven by a view that the advent of oil sanctions on Iran by the US would result in a tight global oil market.”
“However, the view is changing.”
There is a lot on the calendar this week for risk-averse investors to watch.
U.S. retail sales figures for September are reported on Monday, followed by the Fed’s release of the minutes from its last policy meeting on Wednesday and China’s Q3 GDP on Friday. EU leaders meeting in Brussels from Wednesday to Friday are expected to discuss Italy's budget deadlock.
Gold Could Push Toward $1,250
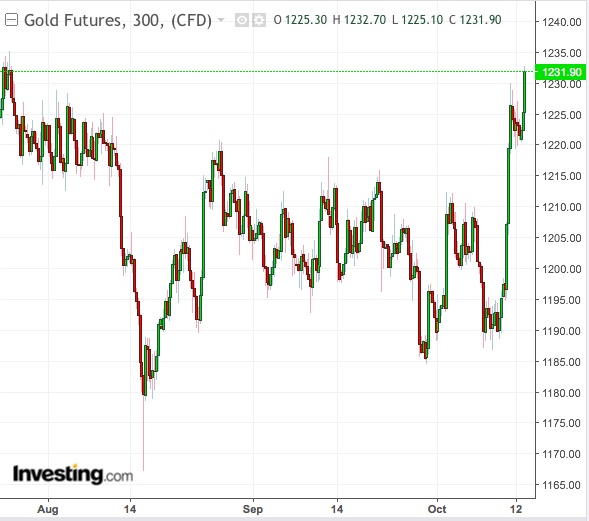
Gold’s push above the $1,210 level—a key resistance till last week—puts the precious metal toward the long anticipated $1,250 highs next, analysts said.
Both spot and futures prices of bullion jumped about 3% on October 11, hitting three-month highs of $1,229.90 an ounce, as slowing global growth and trade tensions drove investors towards safe haven assets.

The gain of more than $34 in that session was the largest in a day since June 2016 and could significantly impact the position held by hedge fund managers and other speculators in gold futures traded on New York’s COMEX. In an October 10 weekly reading, a day before the rally, those traders had extended COMEX gold into deeper bear territory, bulking up their net short positions by 75 percent to 38,175 contracts.
But equally important as those speculator positions, were those held by commercial gold traders who buy and sell for business purposes. This constituency almost doubled its holdings in COMEX gold to 25,866 contracts during the week to October 10. And that looks set to grow after the October 11 rally. The commercial trader positions reflect seasonal demand for gold, especially in India, where a surfeit of year-end religious festivals and weddings bump up use of the yellow metal for auspicious and ornamental purposes.
Global macro and commercial buying aside, looking closer to home, US gold futures could spike on any sign of stronger support or an outright win for Democrats in the November mid-term elections, said Walter Pehowich, executive vice president at Dillon Gage Metals in Addison, Texas. He added: “If there are any surprises, the equity market could take it on the chin,” sending gold toward its next resistance.
Investing.com, which has a “Strong Buy” ranking on gold futures’ December delivery contract, says the next strongest sell indicator for the yellow metal is the 200-Day Moving Average of $1,273.74.
