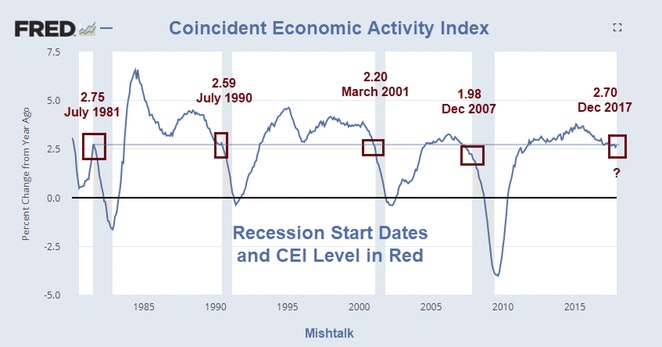
The Philadelphia Fed's coincident economic activity index suggests the economy is close to recession.
The Coincident Economic Activity Index is produced monthly by the Philadelphia Fed.
The indexes are released a few days after the Bureau of Labor Statistics (BLS) releases the employment data for the states.
The coincident indexes combine four state-level indicators to summarize current economic conditions in a single statistic. The four state-level variables in each coincident index are nonfarm payroll employment, average hours worked in manufacturing by production workers, the unemployment rate, and wage and salary disbursements deflated by the consumer price index (U.S. city average). The trend for each state’s index is set to the trend of its gross domestic product (GDP), so long-term growth in the state’s index matches long-term growth in its GDP.
A dynamic single-factor model is used to create the state indexes. James Stock and Mark Watson developed the basic model for constructing a coincident index for the U.S. Theodore Crone and Alan Clayton-Matthews adapted the basic model for the states. The method involves a system of five major equations: one equation for each input variable and one equation for an underlying (latent) factor that is reflected in each of the indicator (input) variables. The underlying factor represents the state coincident index. The model and the input variables are consistent across the 50 states, so the state indexes are comparable to one another.
On a year-over-year basis, recessions have started when the year-over-year CEI was around 2.5 percent.

The Philadelphia Fed also produces leading indexes for each of the 50 states.
The data does not go back as far as the CEI data.
LEI Data Sources
- Delivery times from the ISM Manufacturing Survey can be obtained from the Institute for Supply Management. External Link
- Housing permits can be obtained from the U.S. Census Bureau. External Link
- Initial unemployment insurance claims can be obtained from the Department of Labor. External Link
- Interest rates for the 10-year Treasury bond and the 3-month Treasury bill can be obtained from the Board of Governors. External Link
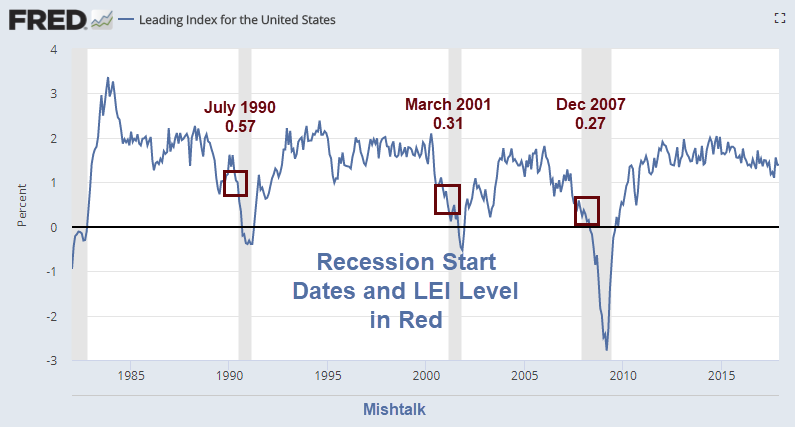
The leading index for each state predicts the six-month growth rate of the state’s coincident index. In addition to the coincident index, the models include other variables that lead the economy: state-level housing permits (1 to 4 units), state initial unemployment insurance claims, delivery times from the Institute for Supply Management (ISM) manufacturing survey, and the interest rate spread between the 10-year Treasury bond and the 3-month Treasury bill.
A time-series model (vector autoregression) is used to construct the leading index. Current and prior values of the forecast variables are used to determine the future values of the index.
The model uses leading index components to predict the coincident index. The concept seems bogus, even more so with a closer look at the allegedly leading indicators.
Permits vs Starts
I question the use of housing permits as a leading indicator. Instead, I suggest using housing starts. Permits are essentially a leading indicator of a leading indicator and hugely wrong at economic turns.
ISM
Reliance on ISM data single-handedly makes the leading indicator report bogus.
For discussion, please see ISM a Leading Indicator? Of What?
