Get 40% Off
🤯 Perficient is up a mind-blowing 53%. Our ProPicks AI saw the buying opportunity in March.Read full update

Clean Sweep: All The Major Asset Classes Posted Gains Last Week

Published 11/09/2020, 07:27 AM
Updated 07/09/2023, 06:31 AM

Global markets rebounded last week, posting across-the-board gains, based on a set of exchange-traded funds as of Friday, Nov. 6. With the pandemic resurging in the US and Europe, however, the prospects for a sustained, broad-based rally look challenged.

Nonetheless, the trading week begins with a solid performance tailwind. Last week’s leader: equities in foreign developed markets Vanguard FTSE Developed Markets Index Fund ETF Shares (NYSE:VEA) surged 7.6%—the fund’s strongest weekly increase since April. The rally lifted the ETF to its highest close so far in the post-coronavirus-crash rebound.
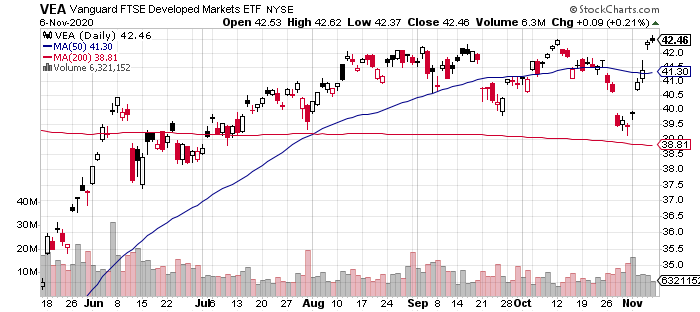
VEA Daily Chart

US (NYSE:VTI) and emerging markets stocks (VWO) were strong performers last week, too, along with US and foreign property shares (VNQ and VNQI, respectively).

US bonds delivered the weakest performance. Inflation-indexed Treasuries rose fractionally, posting the softest gain for the major asset classes.

The widespread rallies dispensed a strong increase for the Global Markets Index (GMI.F) last week. This unmanaged benchmark, which holds all the major asset classes (except cash) in market-value weights via ETFs, rose sharply with a 5.6% increase – GMI’s best weekly rise since April.
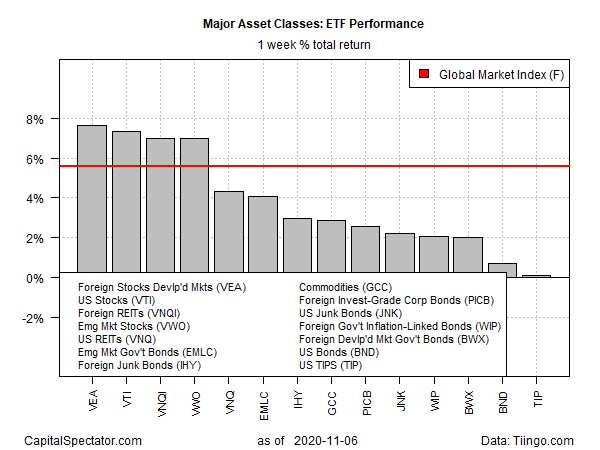
ETFs Weekly Returns

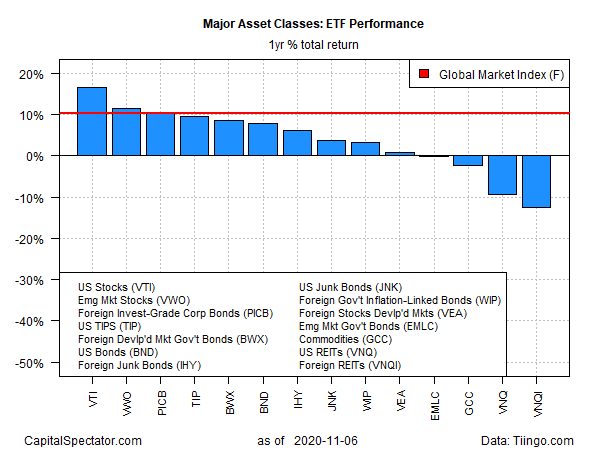
US equities continue to hold the top spot for the trailing one-year trend. Vanguard Total US Stock Market (VTI) ended trading on Friday with a 16.9% total return vs. the year-ago level (based on trailing 252 trading days).

The weakest one-year performance for the major asset classes: foreign real estate stocks. Vanguard Global ex-U.S. Real Estate (VNQI) is in the red by 12.5% over the past 12 months.

GMI.F, on the other hand, is ahead with a solid 10.4% total return for the trailing one-year period.
3rd party Ad. Not an offer or recommendation by Investing.com. See disclosure here or remove ads .

ETFs Yearly Returns

Looking at global markets through the lens of current drawdown, broadly defined commodities (GCC) are currently posting the deepest setback within the major asset classes via a 44% peak-to-trough decline as of last week’s close.

Meanwhile, three funds share honors for posting zero drawdowns at the moment: foreign junk bonds (IHY)), foreign corporate bonds (PICB) and foreign government bonds in developed markets (BWX).

GMI.F’s current drawdown is also zero.
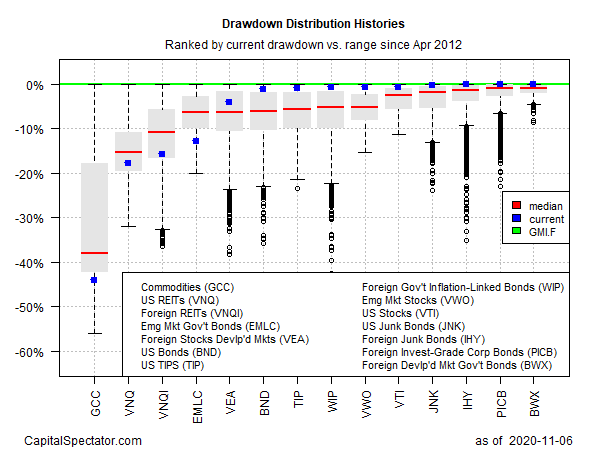
GMI Current Drawdowns

Latest comments

Risk Disclosure: Trading in financial instruments and/or cryptocurrencies involves high risks including the risk of losing some, or all, of your investment amount, and may not be suitable for all investors. Prices of cryptocurrencies are extremely volatile and may be affected by external factors such as financial, regulatory or political events. Trading on margin increases the financial risks.
Before deciding to trade in financial instrument or cryptocurrencies you should be fully informed of the risks and costs associated with trading the financial markets, carefully consider your investment objectives, level of experience, and risk appetite, and seek professional advice where needed.
Fusion Media would like to remind you that the data contained in this website is not necessarily real-time nor accurate. The data and prices on the website are not necessarily provided by any market or exchange, but may be provided by market makers, and so prices may not be accurate and may differ from the actual price at any given market, meaning prices are indicative and not appropriate for trading purposes. Fusion Media and any provider of the data contained in this website will not accept liability for any loss or damage as a result of your trading, or your reliance on the information contained within this website.
It is prohibited to use, store, reproduce, display, modify, transmit or distribute the data contained in this website without the explicit prior written permission of Fusion Media and/or the data provider. All intellectual property rights are reserved by the providers and/or the exchange providing the data contained in this website.
Fusion Media may be compensated by the advertisers that appear on the website, based on your interaction with the advertisements or advertisers.
© 2007-2024 - Fusion Media Limited. All Rights Reserved.