Interest in blockchain technology has substantially increased in China after the speech of the president in which he referred to blockchain as a vital resource for the future of the Chinese economy. An analysis of search queries searches showed that interest in both “Bitcoin” and “Blockchain” has increased dramatically.
Following the announcement, an important official of the Chinese central bank stated that the country plans to issue its own digital currency, DCEP which will soon be ready to launch. This raises the question of whether Chinese cryptocurrencies will have a place in this new financial future or will they be replaced by the country’s own cryptocurrency.
However, several Chinese coins, more specifically NEO, TRX, and ONT have posted daily increases ranging from 20-70%. If they continue doing so, they might lead the may and finally initiate “altseason.”
Crypto influencer @Crypto_Minion stated that the first thing that came to his mind after the announcement, was the effect it would have on Tron and NEO.
The reviews for the coins were mixed, as he praised TRX as the leader of the dapp market, but slandered NEO for its apparent lack of use.
Let’s look at them closely and see their potential for growth.
NEO
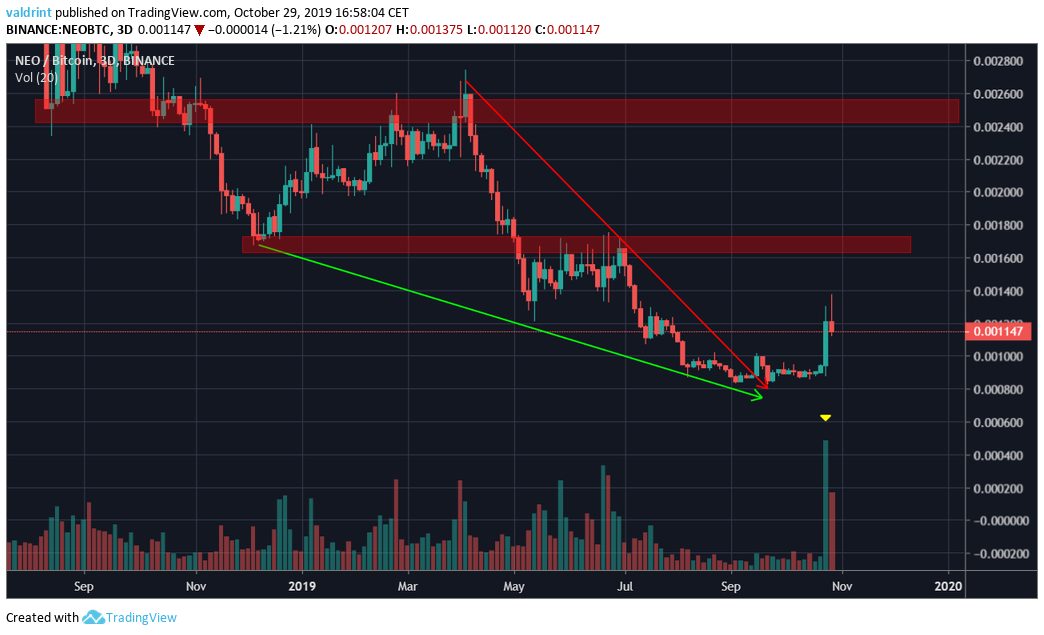
The NEO price seems to have broken out from a long-term descending wedge, which had been in place since November 2018. It has done so with a very high volume.
The closest resistance areas are found at ₿0.00165 and ₿0.0025.

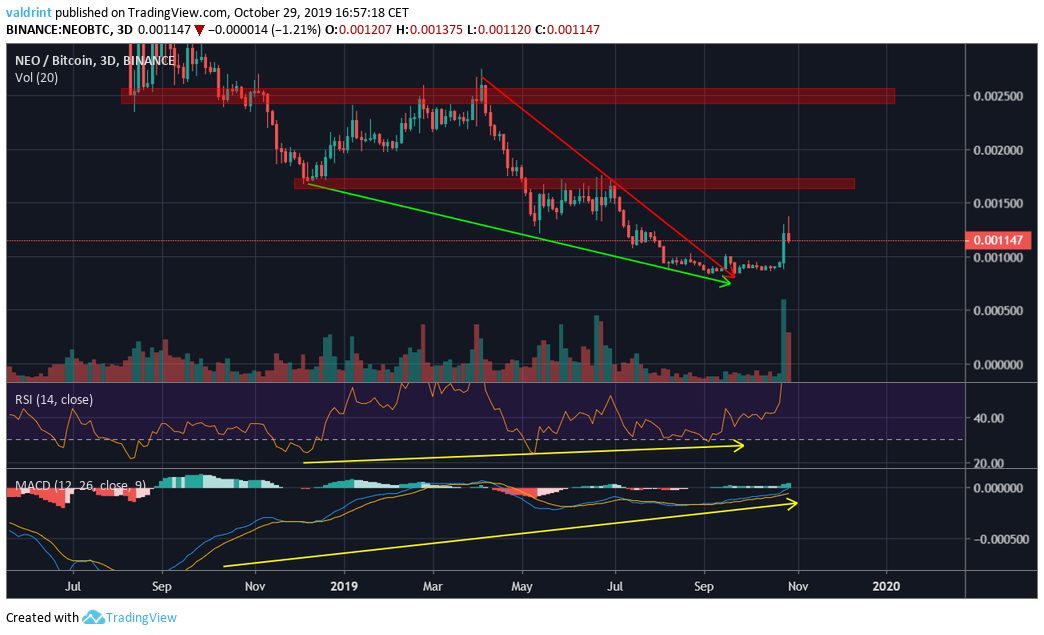
Furthermore, a closer look at technical indicators shows that the breakout was preceded by a very long-term bullish divergence in both the RSI and the MACD, the latter of which is very close to moving into positive territory.

Tron
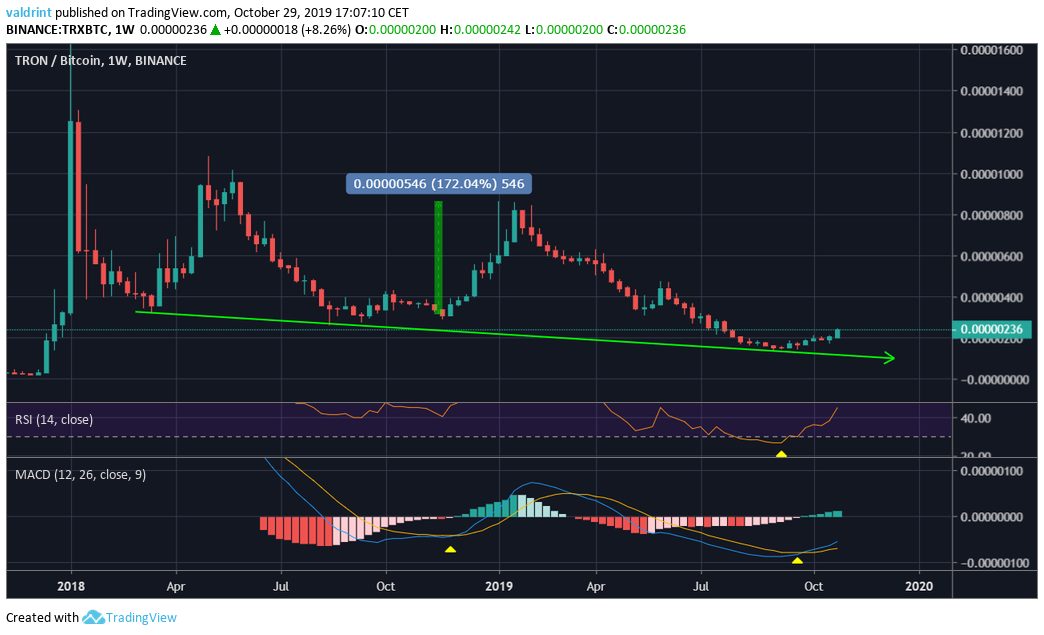
The TRX price has been following a descending support line for 18 months. Once it reached it in September 2019, it began the current upward move.
The MACD has made a bullish cross, which is a very positive development. The only previous time it did so, it increased by roughly 180%.
While the RSI has not developed any divergence, it reached oversold for the first time since its history.

Ontology
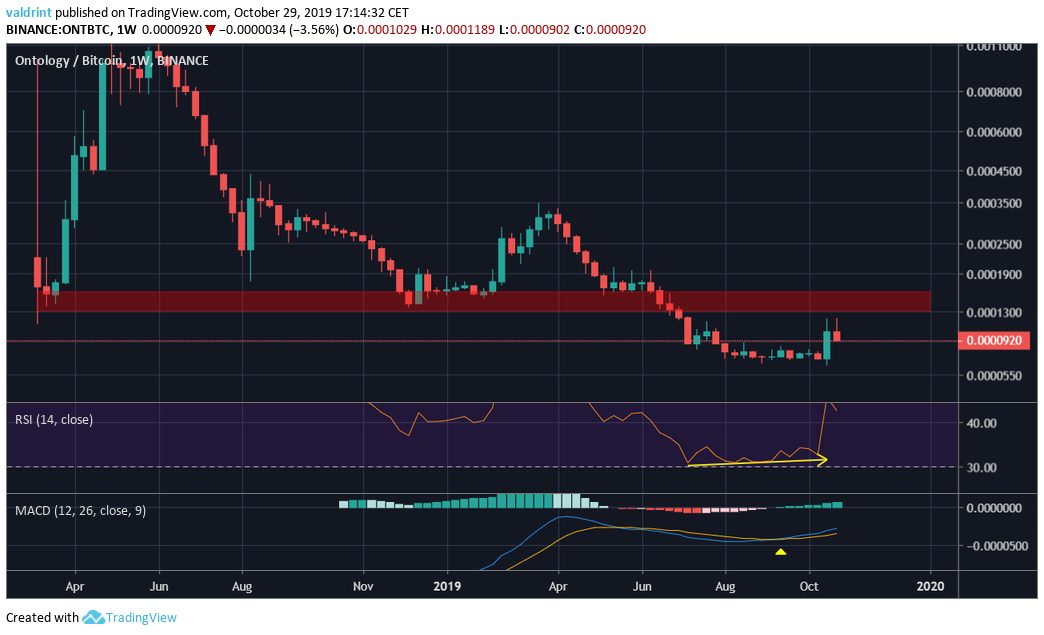
Another interesting Chinese cryptocurrency is ONT. While it was not mentioned in the tweet it increased by 70% in a day, a higher rate than that of NEO or TRX.
The coin is trading at an all-time low.
However, it has developed bullish divergence in both the RSI & MACD, the latter of which has made a bullish cross for the first time.

If the price were to break out above the significant resistance are at 14,000 satoshis, it could initiate a rapid increase similar to that of October 25.
Therefore, if the Bitcoin price fills, the CME gap then continues to increase, causing a new flow of money to enter into the cryptocurrency industry, these Chinese coins could be the ones to finally initiate “altseason.”
