This article was written exclusively for Investing.com
The US dollar index has been falling consistently since peaking in March, as investors started piling into currencies where the central bank was comparatively less dovish than the Federal Reserve and currencies sensitive to the risk-on trade, such as commodity dollars and the euro.
However, against the yen, the losses for the dollar has been contained. That is despite the fact safe haven gold and silver have broken viciously higher, while the Swiss franc, another safe-haven currency, has been rising sharply towards its March peaks versus the greenback. Thus, the key question is this: will the USD/JPY "catch down" with other dollar pairs?
Well, this morning the USD/JPY was looking a bit heavy and there was mild selling of risk assets, including indices. Sentiment was somewhat bearish, as tensions between the US and China escalated and investors wondered whether US equity indices were beginning to look significantly overbought given concerns over further economic impact of the still-rising coronavirus cases, and after an unexpected rise in jobless claims data revived concerns that the recovery may have already stalled at the world’s largest economy. If recovery concerns come to the forefront, then the USD/JPY may be the next big domino to fall as investors pile into the perceived haven that is the Japanese yen.

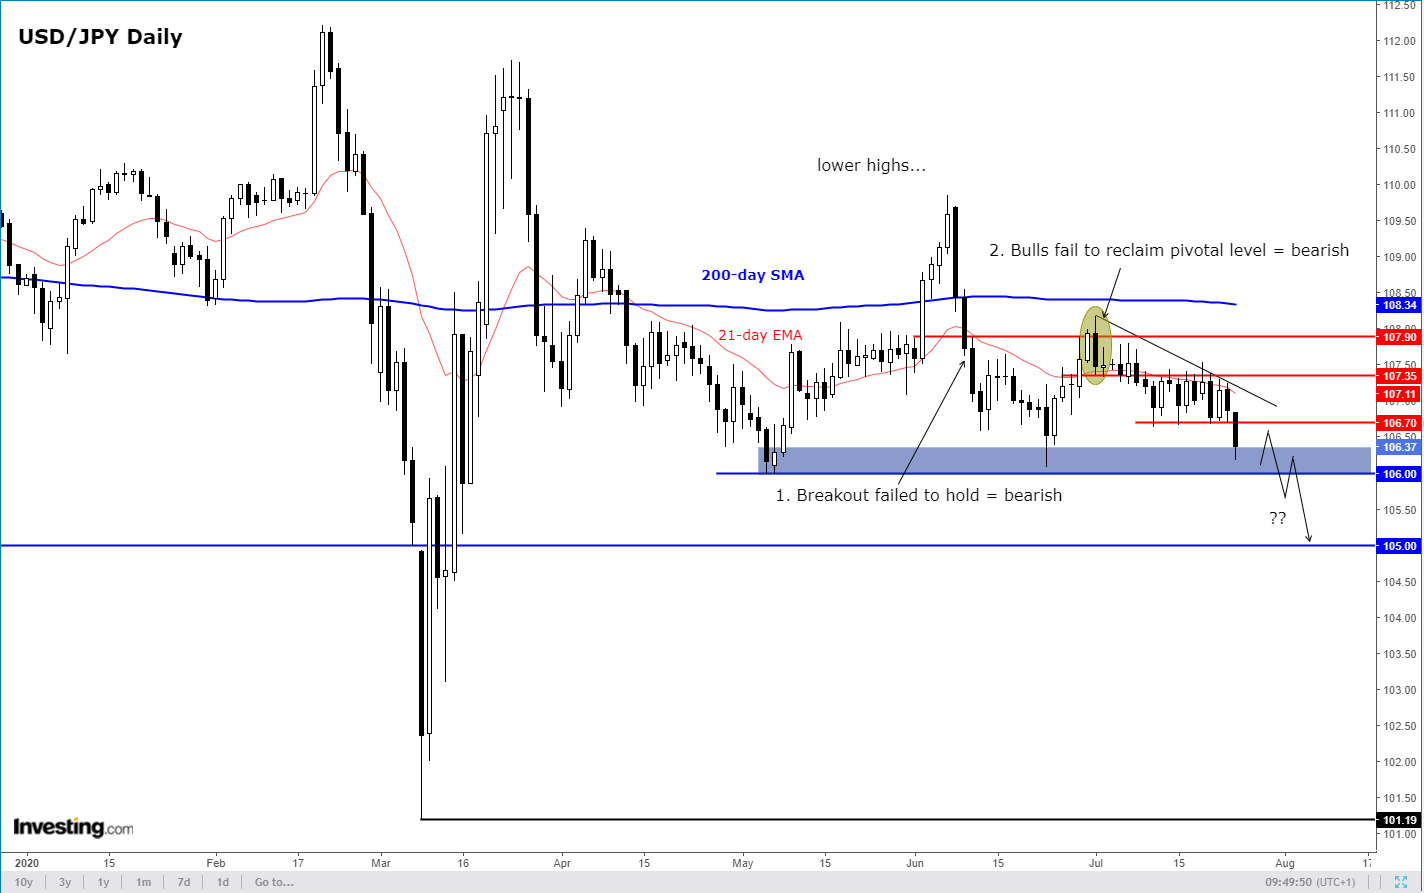
From a technical point of view, the USD/JPY has been looking increasingly bearish over the past several weeks, although a clean breakdown hasn’t yet happened. For me, the big clue that the bulls have been getting into trouble came in the form of price failing to hold its breakout above 107.35 in June.
Following that failure, rates stayed below this level for a while and when the bulls finally attempted to reclaim this level in early July, their advance was rejected as price formed a bearish engulfing candle (circled in yellow on the chart). Since then, the USD/JPY has been drifting lower, with each recovery attempt quickly being rejected.
This morning, the USD/JPY has broken below short-term support at 106.70. This level is now going to be the most important short-term resistance that the bears will need to defend. For as long as rates remain below here, the path of least resistance would be to the downside.
As such, I would be expecting the USD/JPY to break below the next support at around 106.00, possibly later on today or early next week—especially if sentiment towards risky assets turn sour. Should it do so, then the bears’ next two major targets would be the 105 psychological hurdle followed by the March low at just above the 101 handle. Obviously, there will be plenty of other levels in between, but those will be the key downside targets.
However, if the USD/JPY were to go back above 106.70 on a closing basis, this would put the bears in a spot of bother. They will get into real trouble if rates then break the most recent high and resistance circa 107.50, as that would signal that a low has potentially been created.
