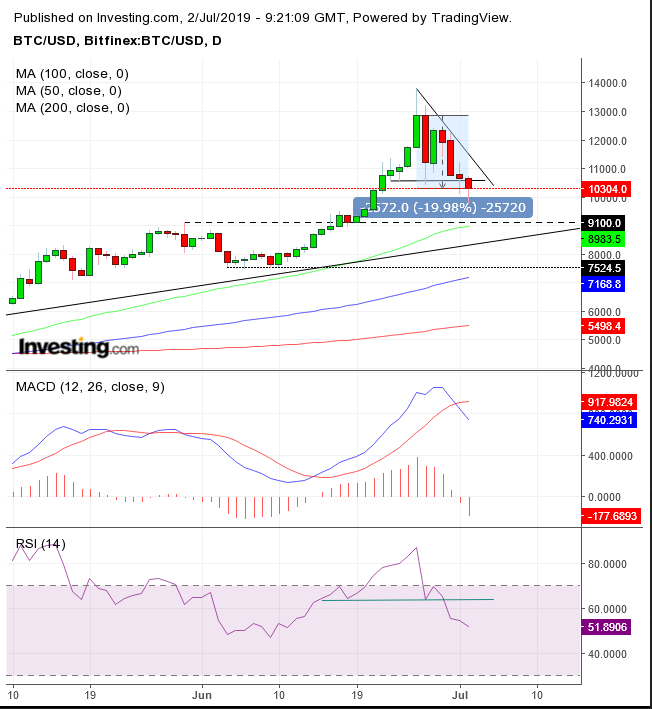
Bitcoin, the world's largest crypto currency by market cap, is falling for the fourth straight day. As of 5:00 EDT today its total loss for the period is around -20%, prompting some to call the slide a bubble burst after an unsustainable rally which began just three weeks ago. That's helped the digital currency gain 163% this year.
However, the coin's price has been rebounding slightly since, paring the four-day loss to 16.6% and bringing the current price to $10,126 at time of writing. Still, the price is clearly teetering on the edge of a bear market. The technical charts may offer some insight into how much deeper it could go.

Some consider today’s drop the completion of a descending triangle. It might be a bearish triangle pattern on a 4-hour chart, targeting shorter time frames and price distances. However, a bona fide triangle on the daily chart requires months to develop.
We do agree, however, that the digital currency requires a correction to sustain its rally. Both the MACD and the RSI have provided sell signals. The MACD short MA has crossed below the long MA. The RSI has completed a H&S top.
We called for a return at least to the psychological $10,000 level, if not to the uptrend line at $8,500 per the current angle. Sure enough, the price rebounded from today’s $9,783.5 low, and is now back above the $10,000 key level, fluctuating above the $10,250 level.
The pullback caused Bitcoin to drop by about $4,000, two thirds of the roughly $6,000 rally in June. Strictly speaking, that should be the maximum correction within a trend. Anything more increases the probability of a reversal. Having said that, this asset, may not necessarily fit into traditional asset analysis.
Therefore, we are inclined to bet on a deeper correction, toward the $9,000 level, where the uptrend line, the 50 DMA and the May high meet.
If the $9,000 level breaks, it could serve as a catalyst for another plunge, reaffirming that the same domino effect of a descending triangle’s completion is playing out. This would be targeting the $7,500 level, based on measuring the height of the triangle, which also coincides with the June lows. If that happens, it would mean the uptrend line had been breached. The next thing traders would analyze are the peaks and troughs, the building blocks of technical analysis. If the $7,500 level breaks, we may very well be back in a downtrend.
Trading Strategies
Conservative traders would wait for the price to bounce off the uptrend line, to enter a long position. If the prices fall below, they would wait on the sidelines, till a clear trend reemerges, with peaks and troughs in one direction.
Moderate traders would enter a long position upon consolidation, as long as the price doesn’t fall below the $7,500 level.
Aggressive traders may short Bitcoin, counting on a deeper correction.
Trade Sample - short position
- Entry: $10,340
- Stop-Loss: $10, 740, above the day’s highs
- Risk: $400
- Target: $9,140, above the confluence of supports mentioned above
- Reward: $1,200
- Risk-Reward Ratio: 1:3
