As it approaches 200% growth YTD, Bitcoin is this year’s hottest asset, digital or otherwise. After a crypto-winter that lasted through 2018, when Bitcoin barely pushed past the $4,000 mark, the coin was regarded as not much of an asset, at least until the value of the technological applications of its blockchain platform could be realized, independent of the currency status.
Now, however, with Bitcoin trading above $11,000, the cryptocurrency has done what many considered impossible after last year's enduring slump: it's breached the half-way point to its all-time high of $20,000 in just three months.
The current market narrative is portraying Facebook Inc (NASDAQ:FB)’s Libra as the catalyst that will legitimize cryptocurrencies, though it will be a competitor. Indeed, ThinkMarkets chief market analyst Naeem Aslam expects the most popular digital currency by market cap to jump to the $60,000 to $100,000 range, as institutions become more comfortable with cryptocurrencies and demonstrate they can in fact store value in times of geopolitical uncertainties.
Aslam forecast on June 17 that Bitcoin would reach $10,000, only five days before it did so. Veteran trader Peter Brandt, who predicted Bitcoin’s crash, now also sees it going to $100,000. The cryptocurrency is currently up about 4.2%, trading around $11,377 on its seventh straight day of gains.
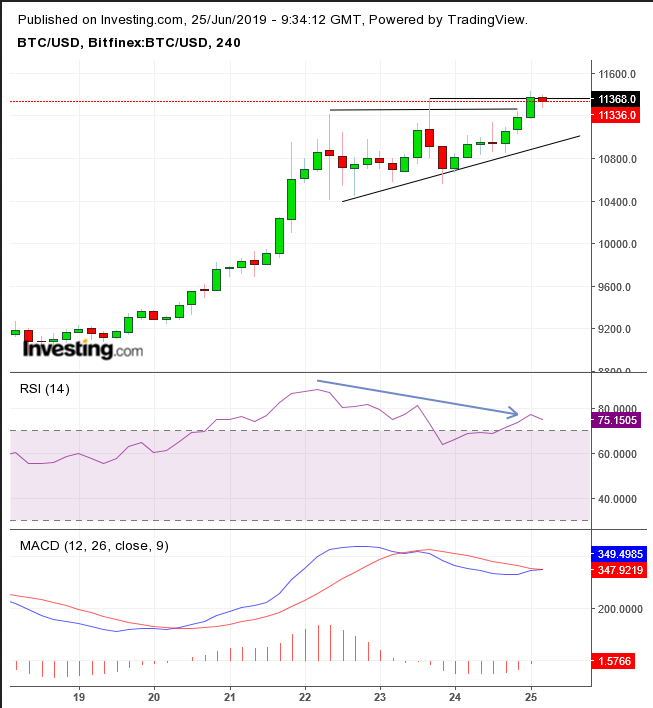
Whether or not the fundamentals warrant such fantastic growth, the chart demonstrates that demand expands along with the rally. While chasing the trend does not necessarily make for sound trading philosophy, we'll keep investors up to date on important market action. But, barring those buying to hold, strict discipline is exceptionally crucial for this highly volatile asset's rodeo ride.

The price has completed an ascending triangle, demonstrating demand has absorbed all available supply and buyers are increasing their bids in order to find willing sellers at higher prices. This market action suggests the break-neck rally still has tailwind. This shift – from ranging to breakout – tends to trigger a domino effect of short squeezes and spurs long positions to keep pushing prices higher.
Note, however, the price has yet to overcome Sunday’s $11,368 high, which is keeping a lid on a reliable upside breakout. As well, the RSI provided a negative divergence, as momentum weakened amid penetration of the pattern top. Finally, the MACD’s short MA found resistance for now below the long MA, displaying pressure.
Trading Strategies – Long Position
Conservative traders should wait for a minimum 3% upside penetration of the triangle’s highest point, Sunday’s high, $11,710, to filter out a bull trap. After that they should wait for a pullback to demonstrate sufficient demand to prop prices higher, with at least one long, green candle engulfing a red or small candle of either color.
Moderate traders may be content with a 2% penetration to $11,600, followed by a return move for a better entry, not necessarily for proof of support.
Trade Sample
- Entry: $11,400
- Stop-Loss: $11,000
- Risk: $400
- Target: $12,600
- Reward: $1,200
- Risk-Reward Ratio: 1:3
Aggressive traders may risk a contrarian short position, hoping to profit on the potential correction.
Trade Sample
- Entry: $11,400
- Stop-Loss: $11,430, above yesterday’s high
- Risk: $30
- Target: $11,100
- Reward: $300
- Risk-Reward Ratio: 1:10
